Ottawa’s MLS® Market Making Headway
December 9, 2024
The number of homes sold through the MLS® System of the Ottawa Real Estate Board (OREB) totaled 1,059 units in November 2024 — a slight dip down from the 1,179 units sold the month previous.
Home sales were 3.1% below the five-year average and 0.5% below the 10-year average for the month of November.
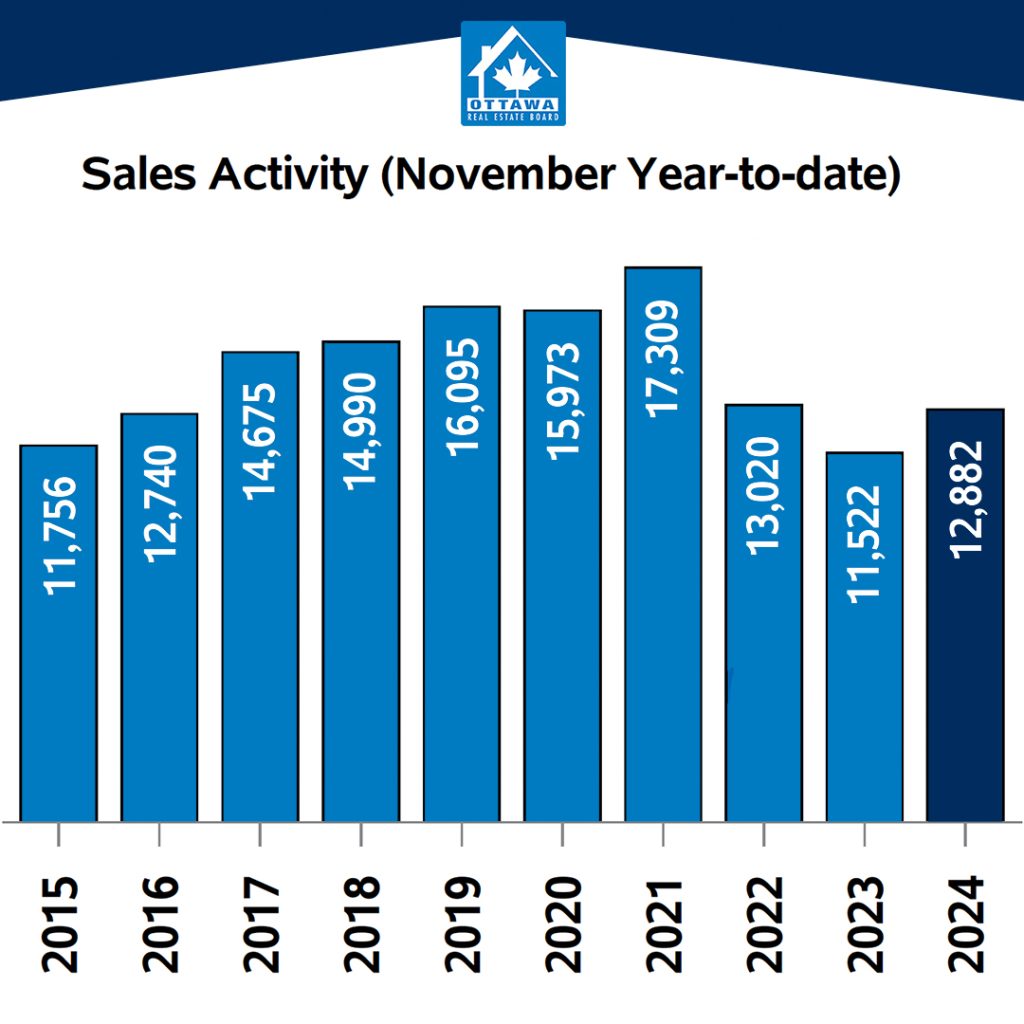
On a year-to-date basis, home sales totaled 12,882 units in November 2024 — an increase of 11.8% from the same period in 2023.
“Ottawa’s market is making headway on a long road back from the slowdown experienced in 2023,” says OREB Past-President Curtis Fillier. “Buyers have been slow to come back to the market while watching the interest rates lower, and some are waiting to see how new mortgage rules — the extended amortization period and the increased default insurance cap — coming into effect in December may redefine their purchasing power. Sellers have noticed that caution and those who can are likely holding on for a more active spring.”
“There will be the typical slowdown at this time of the year as people’s attentions turn to the holidays, and the snow starts to cover a property’s selling features,” says Fillier. “With prices holding steady and open houses getting traffic, though, people are keeping a close eye on opportunities.”
By the Numbers – Prices:
The MLS® Home Price Index (HPI) tracks price trends far more accurately than is possible using average or median price measures.
- The overall MLS® HPI composite benchmark price was $636,700 in November 2024, an increase of 1.5% from November 2023.
- The benchmark price for single-family homes was $722,400, up 2.1% on a year-over-year basis in November.
- By comparison, the benchmark price for a townhouse/row unit was $491,500, up 0.3% compared to a year earlier.
- The benchmark apartment price was $406,200, down 3.7% from last year.
- The average price of homes sold in November 2024 was $667,098 increasing 4.6% from November 2023.
- The more comprehensive year-to-date average price was $679,797, increasing by 1.2% from November 2023.
- The dollar volume of all home sales in November 2024 was $706.4 million, up 51.8% from November 2023.
OREB cautions that the average sale price can be useful in establishing trends over time but should not be used as an indicator that specific properties have increased or decreased in value. The calculation of the average sale price is based on the total dollar volume of all properties sold. Prices will vary from neighbourhood to neighbourhood.
By the Numbers – Inventory & New Listings
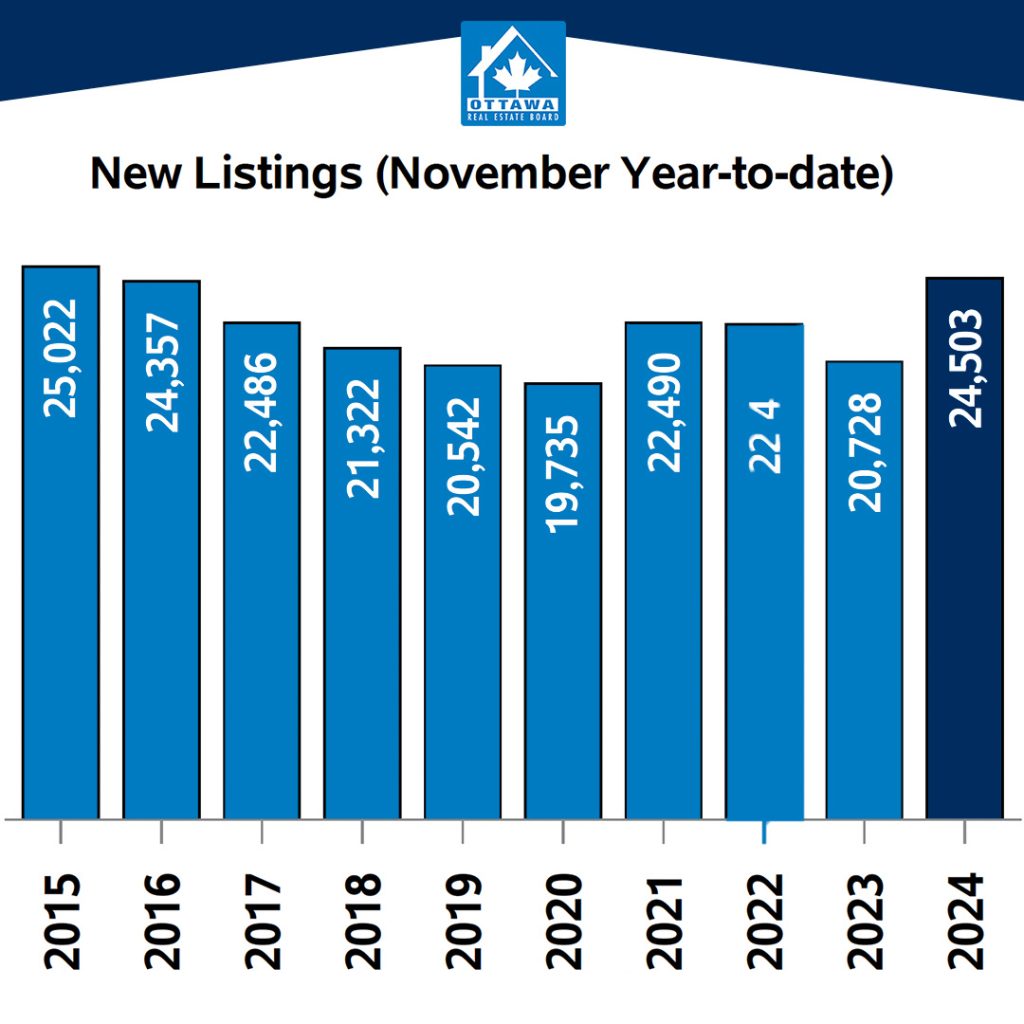
- The number of new listings saw a decrease of 7.3% from November 2023. There were 1,352 new residential listings in November 2024. New listings were 6.3% below the five-year average and 0.3% above the 10-year average for the month of November.
- Active residential listings numbered 4,036 units on the market at the end of November 2024, a gain of 38.2% from November 2023. Active listings were 72.8% above the five-year average and 44.3% above the 10-year average for the month of November.
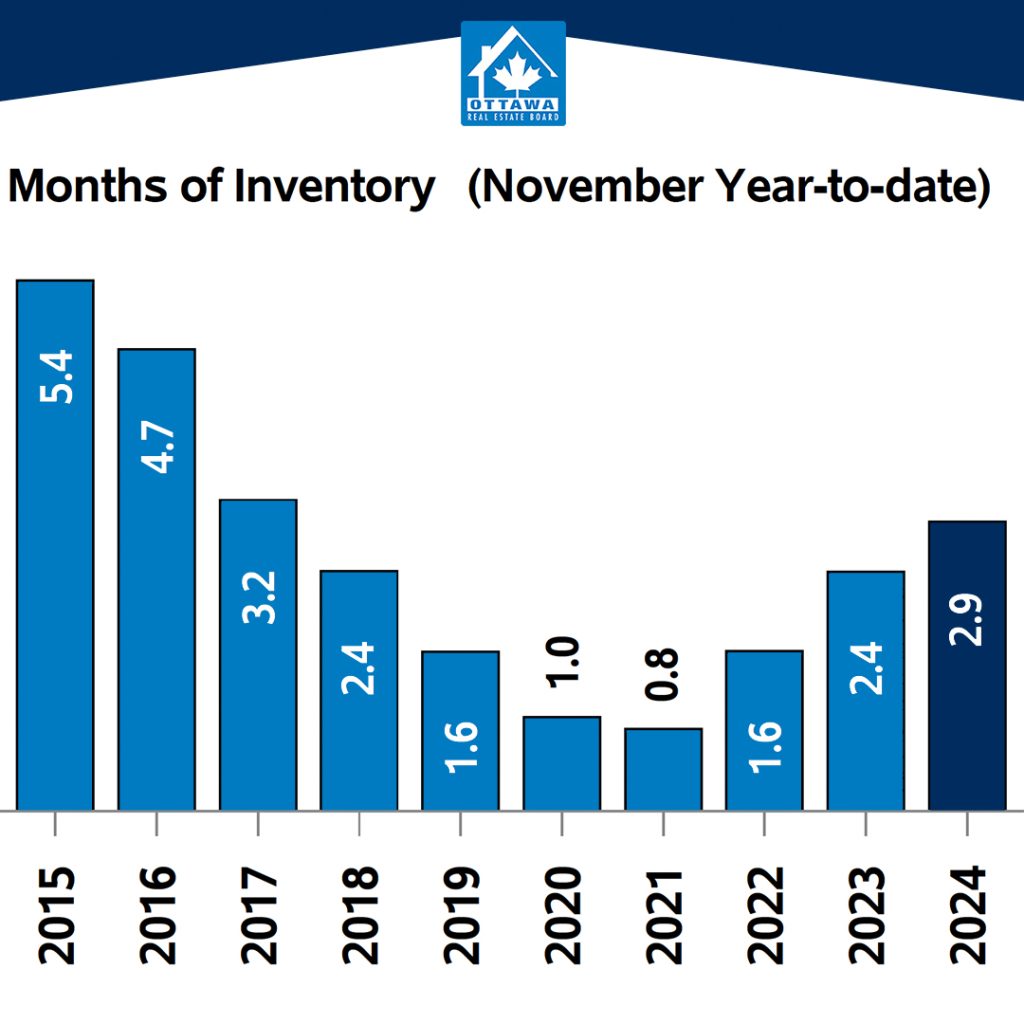
- Months of inventory numbered 3.8 at the end of November 2024, compared to 4.0 in November 2023. The number of months of inventory is the number of months it would take to sell current inventories at the current rate of sales activity.

