Ottawa’s MLS® Activity Builds After Recovering from Prior Slowdown
July 4, 2024
The number of homes sold through the MLS® System of the Ottawa Real Estate Board (OREB) totaled 1,439 units in June 2024. This was a marginal increase of 0.1% from June 2023.
Home sales were 7.5% below the five-year average and 13.2% below the 10-year average for the month of June.
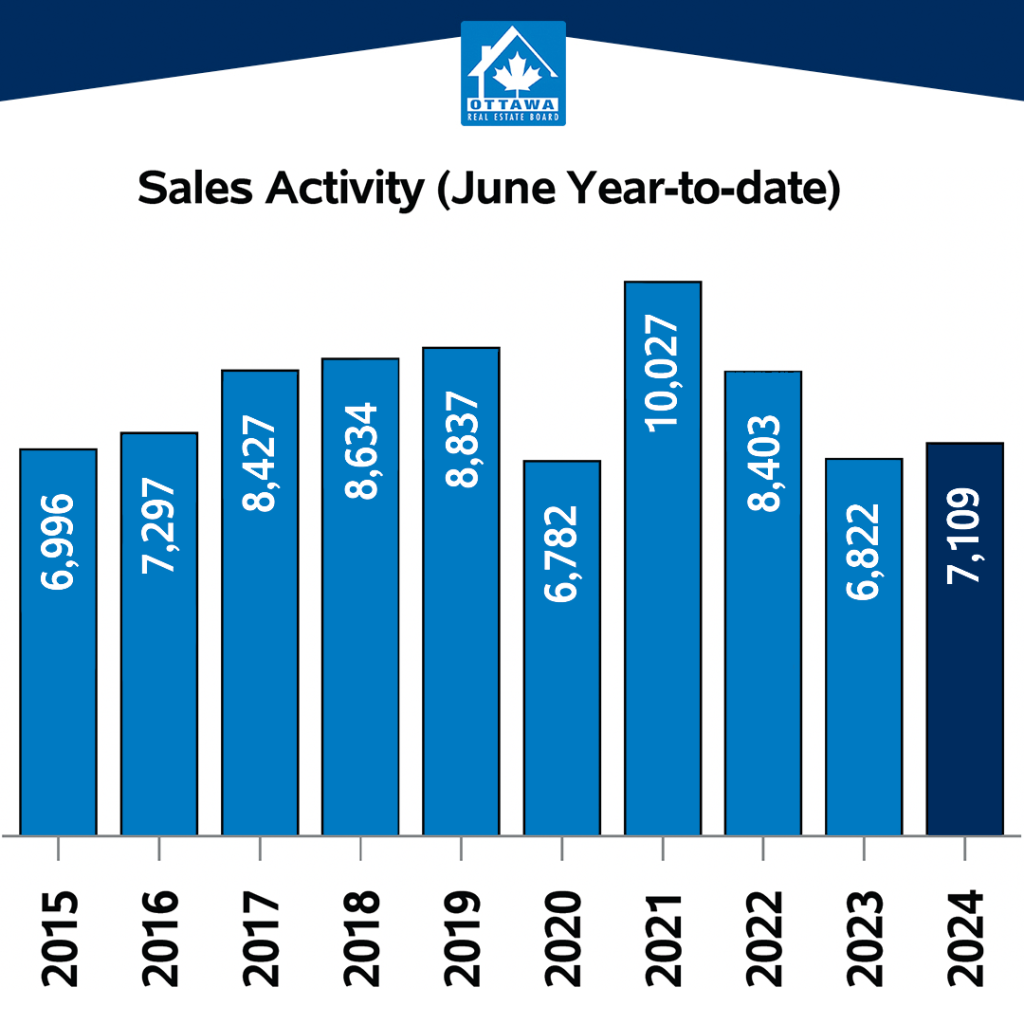
On a year-to-date basis, home sales totaled 7,109 units over the first half of the year — an increase of 4.2% from the same period in 2023.
“Ottawa continues to see steady activity as we head into the summer market,” says OREB President Curtis Fillier. “Unlike recent years, buyers have more room to wait, evaluate and be selective when searching for the right property at the right price, leading to a slight uptick in the days on market. Sellers are making moves as evidenced by the inventory and listings. After recovering from last year’s slowdown, Ottawa’s market performance is nearly back on par and continues to make gains.
“It’s going to be an interesting summer and next half of the year. As confidence builds, there will be ample opportunities for both parties. Now is the time for sellers to ensure their property is at its best and priced appropriately to attract buyers who remain slightly reluctant. Buyers would do well to remember that inventory levels — and competition — can swing quickly in Ottawa’s tight market.”
By the Numbers – Prices:
The MLS® Home Price Index (HPI) tracks price trends far more accurately than is possible using average or median price measures.
- The overall MLS® HPI composite benchmark price was $647,700 in June 2024, a decrease of 0.5% from June 2023.
- The benchmark price for single-family homes was $734,300, down 0.2% on a year-over-year basis in June.
- By comparison, the benchmark price for a townhouse/row unit was $501,500, down 1.6% compared to a year earlier.
- The benchmark apartment price was $420,800, down 1.7% from year-ago levels.
- The average price of homes sold in June 2024 was $686,535 increasing 0.5% from June 2023. The more comprehensive year-to-date average price was $681,345, increasing by 1.6% from the first six months of 2023.
- The dollar volume of all home sales in June 2024 was $987.9 million, up 0.7% from June 2023.
OREB cautions that the average sale price can be useful in establishing trends over time but should not be used as an indicator that specific properties have increased or decreased in value. The calculation of the average sale price is based on the total dollar volume of all properties sold. Prices will vary from neighbourhood to neighbourhood.
By the Numbers – Inventory & New Listings
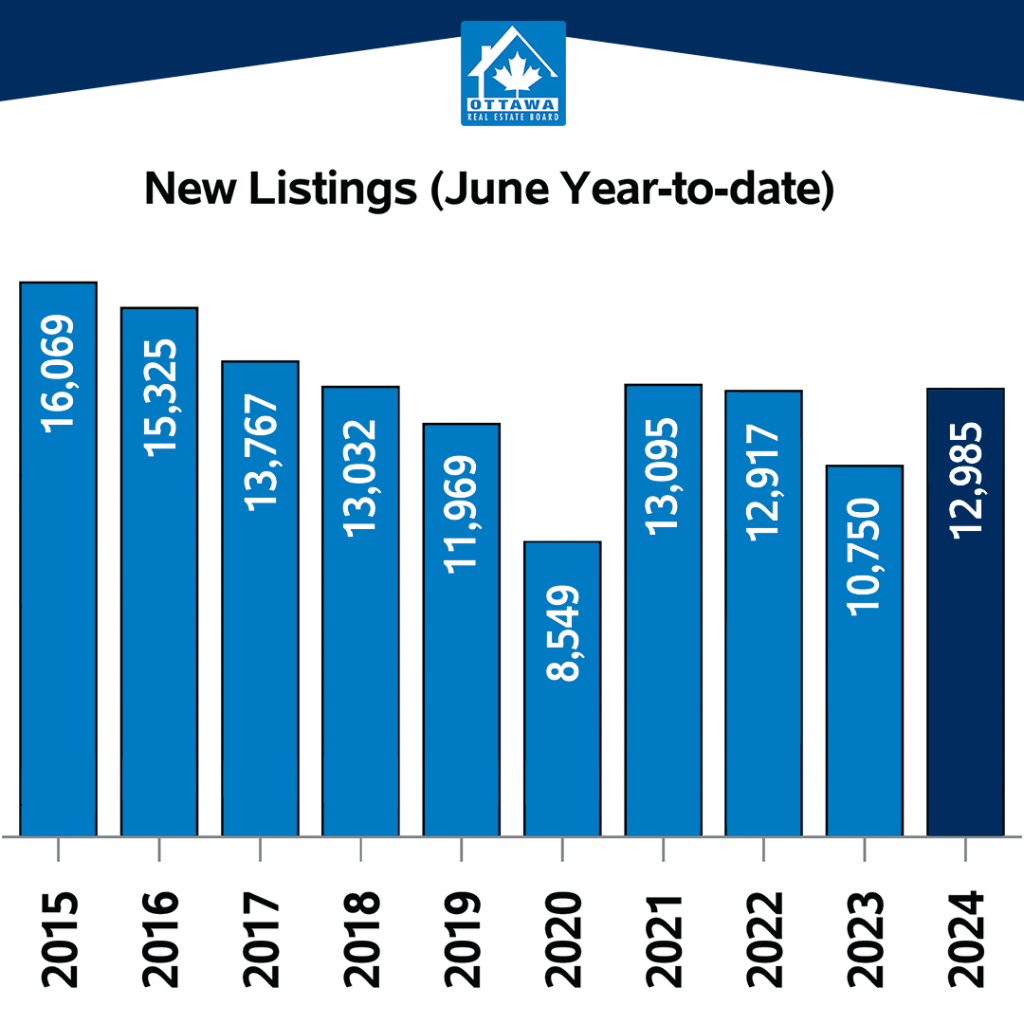
- The number of new listings saw an increase of 4.7% from June 2023. There were 2,469 new residential listings in June 2024. New listings were 0.8% below the five-year average and 1% below the 10-year average for the month of June.
- Active residential listings numbered 3,585 units on the market at the end of June 2024, a gain of 45.5% from June 2023. Active listings were 57.8% above the five-year average and 1.9% below the 10-year average for the month of June.
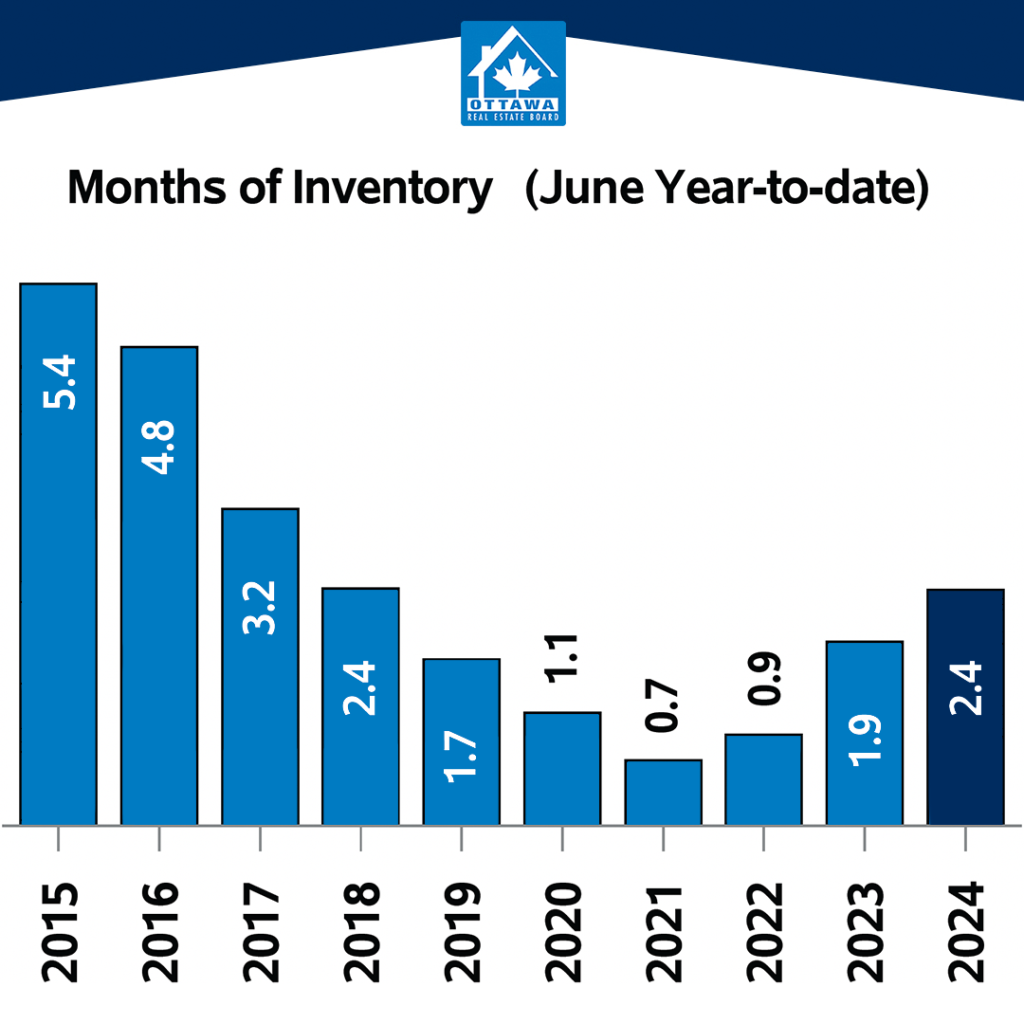
- Months of inventory numbered 2.5 at the end of June 2024, up from 1.7 in June 2023. The number of months of inventory is the number of months it would take to sell current inventories at the current rate of sales activity.