Ottawa’s Market Warms Up with More Listings and Cautious Buyers
February 7, 2025
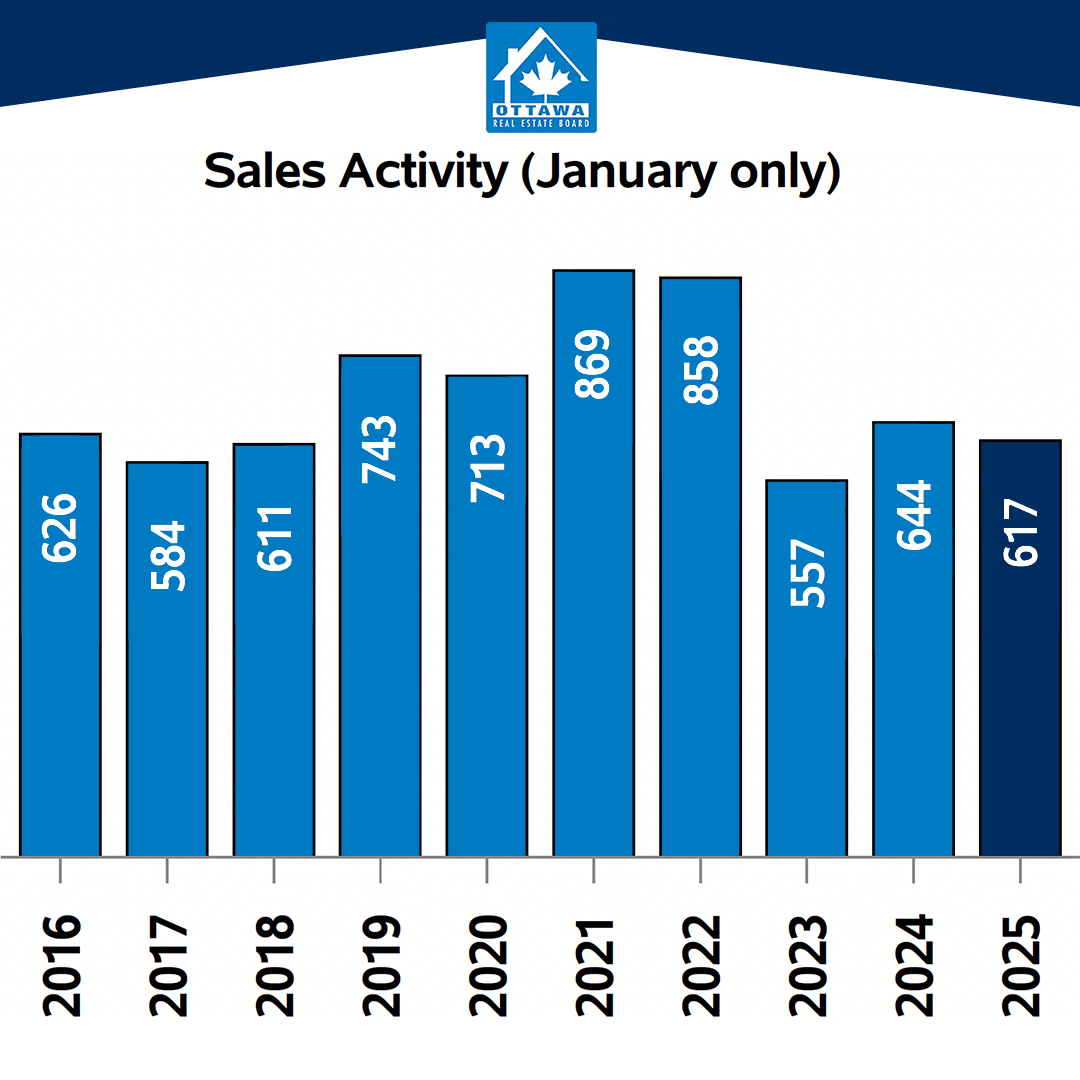
The number of homes sold through the MLS® System of the Ottawa Real Estate Board (OREB) totaled 617 units in January 2025. This was a 4.2% decrease from January 2024.
Home sales were 13% below the five-year average and 9.6% below the 10-year average for the month of January.
“Ottawa’s market is seeing increased activity as more listings hit the market and buyers start to re-engage,” says OREB President Paul Czan. “Many buyers and sellers had been waiting for more conducive market conditions, but with the recent rate cut and potentially lower interest rates on the horizon, optimism is growing. While there’s more supply, the availability of suitable properties in various market segments remains tight. This is reflected in some homes selling quickly while others linger on the market. Sellers should be prepared to price competitively and present their homes in the best light to capture buyer interest in this evolving market.”
“The recent Bank of Canada rate cut, introduction of U.S. tariffs, along with upcoming provincial and federal elections, introduce factors of variability,” adds Czan. “That said, confidence is growing, and more buyers are expected to return to the market in the coming months, leading to an increase in transactions.”
By the Numbers – Prices:
The MLS® Home Price Index (HPI) tracks price trends far more accurately than is possible using average or median price measures.
- The overall MLS® HPI composite benchmark price was $649,900 in January 2025, an increase of 5.2% from January 2024.
- The benchmark price for single-family homes was $713,000 up 2.3% on a year-over-year basis in January.
- By comparison, the benchmark price for a townhouse/row unit was $448,000, down 3.9% compared to a year earlier.
- The benchmark apartment price was $436,900, up 4.5% from last year.
- The average price of homes sold in January 2025 was $670,258, increasing 5.8% from January 2024.
- The dollar volume of all home sales in January 2025 was $413.5 million, up 1.3% from January 2024.
OREB cautions that the average sale price can be useful in establishing trends over time but should not be used as an indicator that specific properties have increased or decreased in value. The calculation of the average sale price is based on the total dollar volume of all properties sold. Prices will vary from neighbourhood to neighbourhood.
By the Numbers – Inventory & New Listings
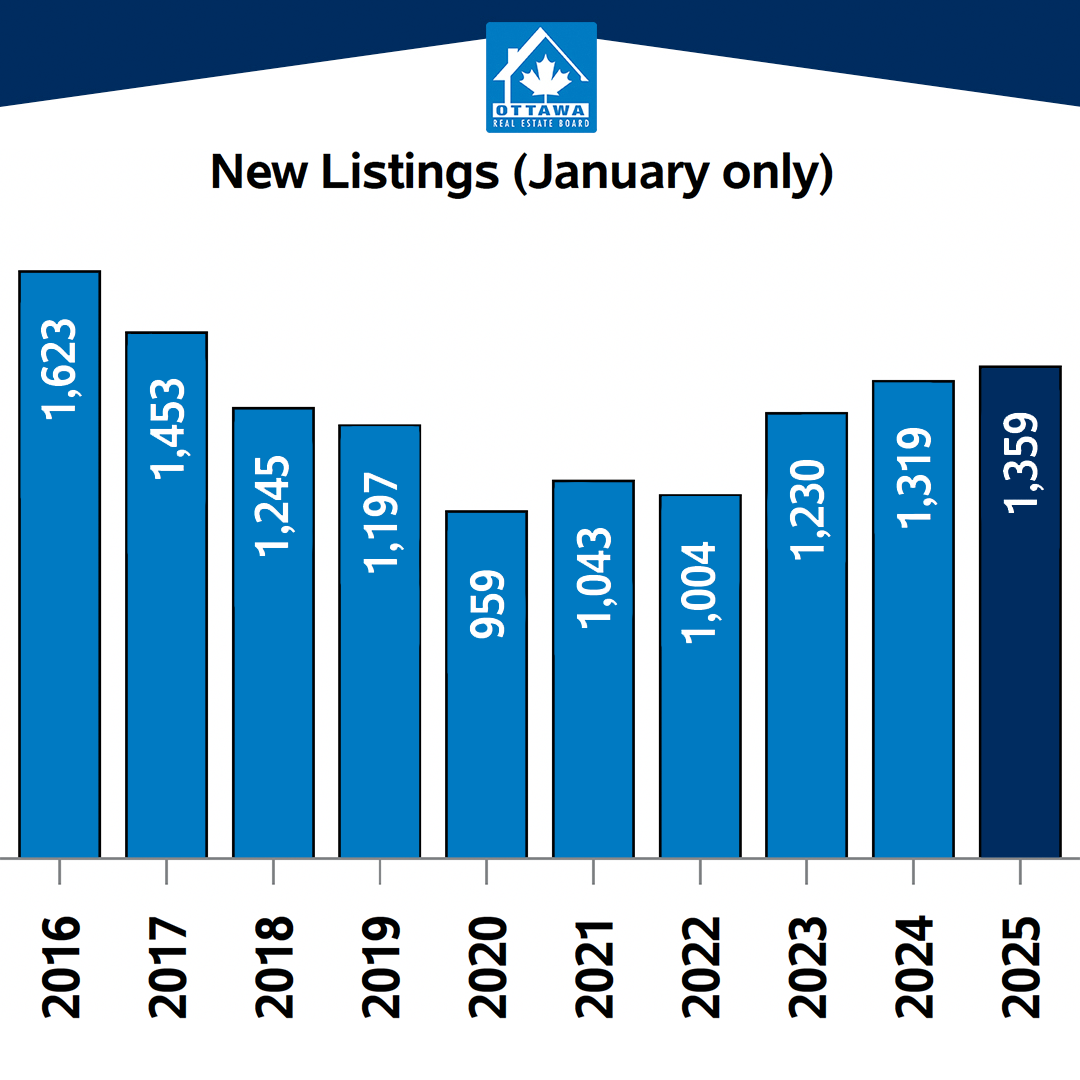
- The number of new listings saw an increase of 3.0% from January 2024. There were 1,359 new residential listings in January 2025. New listings were 14.1% above the five-year average and 9.3% above the 10-year average for the month of January.
- Active residential listings numbered 3,312 units on the market at the end of January 2025, a gain of 57.3% from January 2024. Active listings were 90.6% above the five-year average and 48.9% above the 10-year average for the month of January.
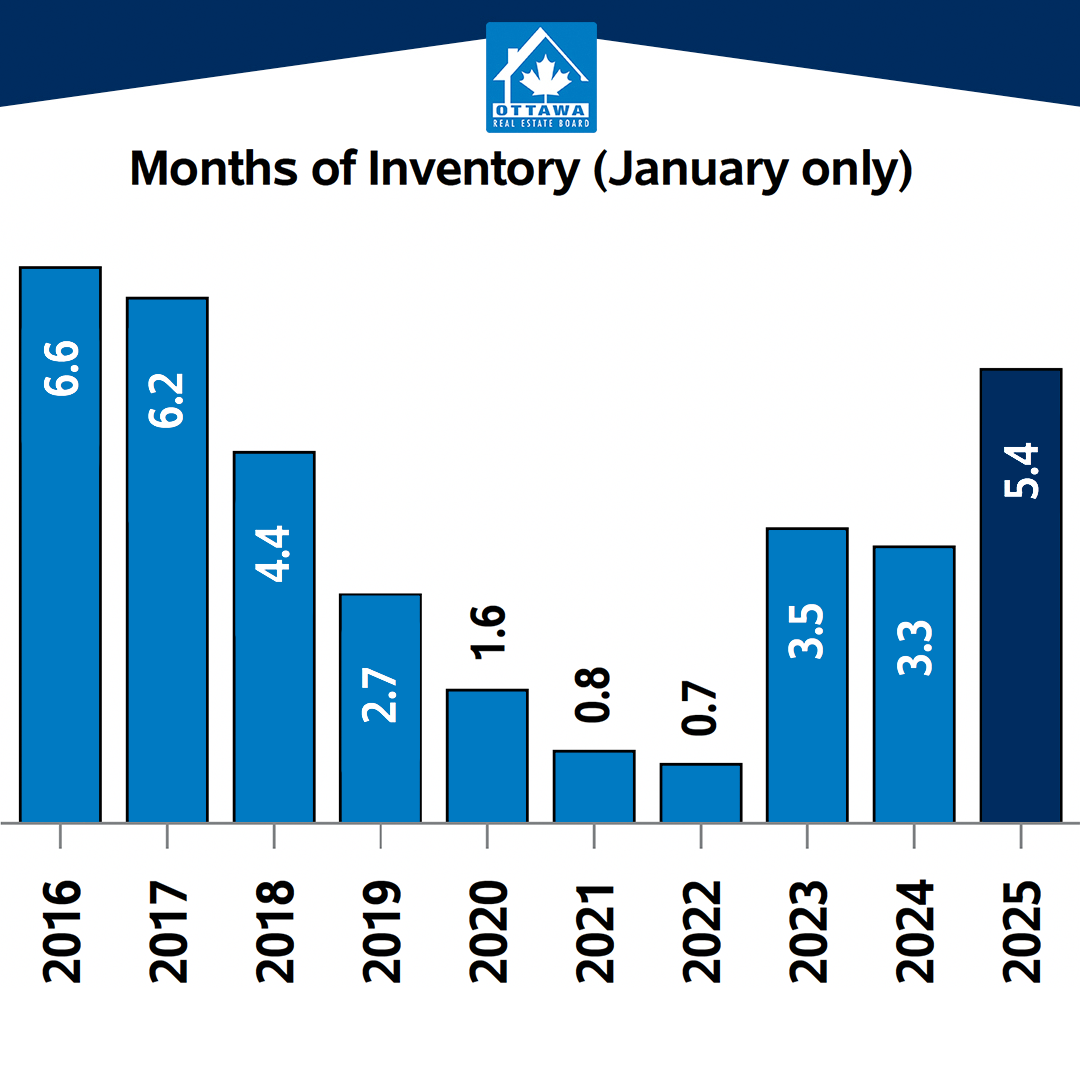
- Months of inventory numbered 5.4 at the end of January 2025, compared to 3.3 in January 2024. The number of months of inventory is the number of months it would take to sell current inventories at the current rate of sales activity.