ARCHIVE

Ottawa’s MLS® December Market Closes Year with Optimism

The number of homes sold through the MLS® System of the Ottawa Real Estate Board (OREB) totaled 613 units in December 2024. This was a 7.9% increase from December 2023.  

Home sales were 6.8% below the five-year average and 2.7% below the 10-year average for the month of December.

On a year-to-date basis, home sales totaled 13,526 units in December 2024 — an increase of 11.8% from the same period in 2023.

“A year of wait-and-see came to a close with the expected slowdown over the holiday season,” says OREB President Paul Czan. “The latter half of the year brought signs of more favourable market conditions with consecutive interest rate drops, higher insured mortgage limits and extended amortizations. It’s early to assess the impact of these measures. And it’s an uphill battle against affordability and supply issues that persist.”

“Listing activity indicates that sellers anticipate improved conditions could spur more activity from buyers who have been keeping a close eye on the market but hesitant to make moves. Buyers are still limited in their selection of affordable inventory that can meet current demands, which stalls movement. While the improving market conditions are encouraging, the supply needs to be there. Coming political shifts are adding a layer of uncertainty but there is a trending optimism for more increased market activity in the months ahead.”

By the Numbers – Prices: 

The MLS® Home Price Index (HPI) tracks price trends far more accurately than is possible using average or median price measures. 

  • The overall MLS® HPI composite benchmark price was $645,800 in December 2024, an increase of 3.8% from December 2023.
    • The benchmark price for single-family homes was $729,300, up 3.7% on a year-over-year basis in December.
    • By comparison, the benchmark price for a townhouse/row unit was $533,200, up 11.3% compared to a year earlier.
    • The benchmark apartment price was $404,400, down 2.5% from last year.
  • The average price of homes sold in December 2024 was $663,781, increasing 4.4% from December 2023. The more comprehensive year-to-date average price was $679,067, increasing by 1.3% from last year.
  • The dollar volume of all home sales in December 2024 was $406.9 million, up 12.7% from December 2023. The total dollar volume of all home sales in 2024 was $9.2 billion, up 13.3% from all of 2023.

OREB cautions that the average sale price can be useful in establishing trends over time but should not be used as an indicator that specific properties have increased or decreased in value. The calculation of the average sale price is based on the total dollar volume of all properties sold. Prices will vary from neighbourhood to neighbourhood.  

By the Numbers – Inventory & New Listings 

  • The number of new listings saw an increase of 13.6% from December 2023. There were 603 new residential listings in December 2024. New listings were 3.5% above the five-year average and 2.7% below the 10-year average for the month of December.

  • Active residential listings numbered 3,216 units on the market at the end of December 2024, a gain of 58.7% from December 2023. Active listings were 90% above the five-year average and 51.4% above the 10-year average for the month of December.

  • Months of inventory numbered 5.2 at the end of December 2024, compared to 3.6 in December 2023. The number of months of inventory is the number of months it would take to sell current inventories at the current rate of sales activity.

Ottawa’s MLS® Market Making Headway

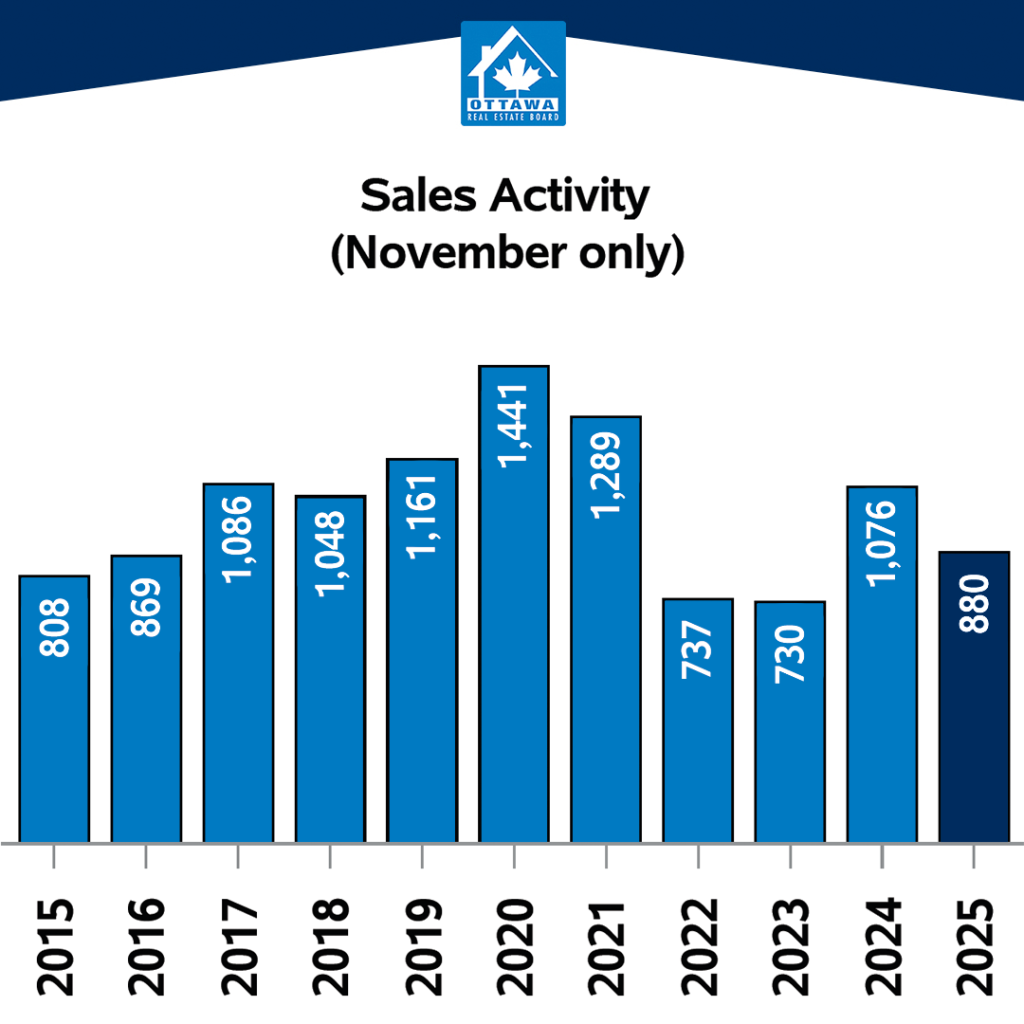
The number of homes sold through the MLS® System of the Ottawa Real Estate Board (OREB) totaled 1,059 units in November 2024 — a slight dip down from the 1,179 units sold the month previous. 

Home sales were 3.1% below the five-year average and 0.5% below the 10-year average for the month of November. 

On a year-to-date basis, home sales totaled 12,882 units in November 2024 — an increase of 11.8% from the same period in 2023.  

“Ottawa’s market is making headway on a long road back from the slowdown experienced in 2023,” says OREB Past-President Curtis Fillier. “Buyers have been slow to come back to the market while watching the interest rates lower, and some are waiting to see how new mortgage rules — the extended amortization period and the increased default insurance cap — coming into effect in December may redefine their purchasing power. Sellers have noticed that caution and those who can are likely holding on for a more active spring.” 

“There will be the typical slowdown at this time of the year as people’s attentions turn to the holidays, and the snow starts to cover a property’s selling features,” says Fillier. “With prices holding steady and open houses getting traffic, though, people are keeping a close eye on opportunities.”  

By the Numbers – Prices: 

The MLS® Home Price Index (HPI) tracks price trends far more accurately than is possible using average or median price measures. 

  • The overall MLS® HPI composite benchmark price was $636,700 in November 2024, an increase of 1.5% from November 2023.
    • The benchmark price for single-family homes was $722,400, up 2.1% on a year-over-year basis in November.
    • By comparison, the benchmark price for a townhouse/row unit was $491,500, up 0.3% compared to a year earlier.
    • The benchmark apartment price was $406,200, down 3.7% from last year.
  • The average price of homes sold in November 2024 was $667,098 increasing 4.6% from November 2023.
  • The more comprehensive year-to-date average price was $679,797, increasing by 1.2% from November 2023.
  • The dollar volume of all home sales in November 2024 was $706.4 million, up 51.8% from November 2023.

OREB cautions that the average sale price can be useful in establishing trends over time but should not be used as an indicator that specific properties have increased or decreased in value. The calculation of the average sale price is based on the total dollar volume of all properties sold. Prices will vary from neighbourhood to neighbourhood.  

By the Numbers – Inventory & New Listings 

  • The number of new listings saw a decrease of 7.3% from November 2023. There were 1,352 new residential listings in November 2024. New listings were 6.3% below the five-year average and 0.3% above the 10-year average for the month of November.

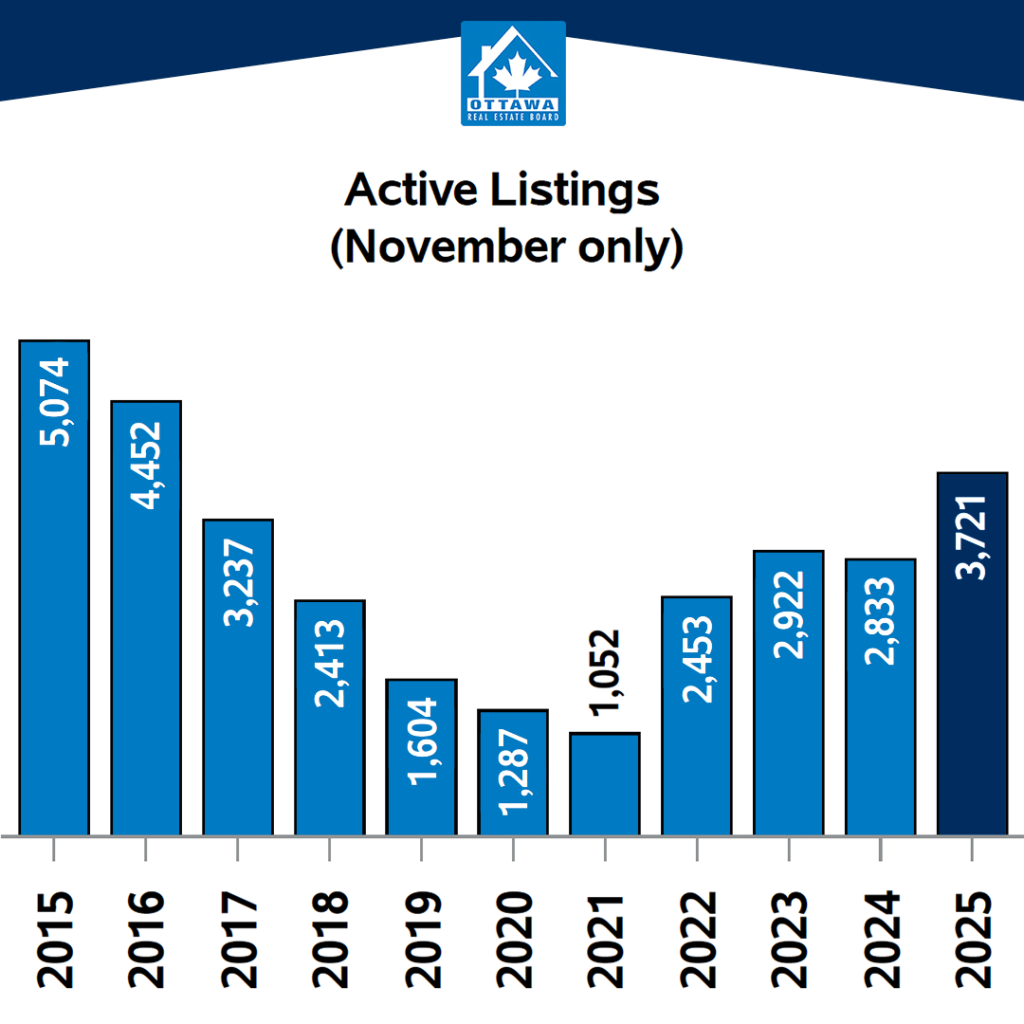
  • Active residential listings numbered 4,036 units on the market at the end of November 2024, a gain of 38.2% from November 2023. Active listings were 72.8% above the five-year average and 44.3% above the 10-year average for the month of November.

  • Months of inventory numbered 3.8 at the end of November 2024, compared to 4.0 in November 2023. The number of months of inventory is the number of months it would take to sell current inventories at the current rate of sales activity.

Eastern Ontario Real Estate Boards Tentatively Approve Integration

The Boards of Directors of the Ottawa Real Estate Board (OREB), Cornwall and District Real Estate Board (CDREB), Kingston and Area Real Estate Association (KAREA), Renfrew County Real Estate Board (RCREB), and Rideau-St. Lawrence Real Estate Board (RSLREB) are excited to announce the tentative approval of a groundbreaking integration. This initiative aims to unify over 5,200 REALTORS®, combining the strengths of these associations to create the third-largest real estate association in Ontario.

The decision to proceed with the integration will require approval from our Members. In accordance with our bylaws, each of our associations will hold a special general meeting to bring the proposed integration to a vote. These meetings are planned for the last week of February 2025, with further details to be shared soon. Starting in January, we will host a series of town hall meetings to present the integration plan. Additionally, we will provide comprehensive information through our website and other communication channels, ensuring that all Members have the resources needed to make an informed decision.

The proposed integration is designed to enhance the services provided to REALTOR® Members, enabling them to thrive in an evolving real estate landscape and deliver exceptional service to clients. By merging, the regional associations will form a more influential and resourceful organization, better equipped to address industry challenges and seize new opportunities for the benefit of our Members.

“As part of a larger association, we will have a stronger voice within organized real estate, representing the perspectives of REALTORS® across Eastern Ontario,” said Troy Vaillancourt, Past-President of CDREB. “This integration will also enable us to offer more programs and services, deepen educational opportunities, and expand and improve relationships with external stakeholders.”

Erin Finn, President of KAREA, emphasized the shared vision driving this initiative. “This integration builds on our mutual commitment to member service and volunteer engagement. We look forward to collaborating with Members and volunteers across the region to shape the new association’s culture and guiding principles.”

Curtis Fillier, President of OREB, emphasized the technological advantages of collaboration: “By combining our resources, we are enhancing the strength and reliability of our technology tools and services. Our recent transition to PropTx secures barrier-free access to critical real estate information, statistics and tools, enabling us to be more cooperative and competitive. Integration will ensure that access to rich, high-quality MLS® data is the standard moving forward for all Eastern Ontario Members.”

RCREB President Amanda McParland spoke of the value this integration brings to Members. “Our Members will gain access to a broader array of services while preserving cherished local offerings like market insights, networking events, and charitable initiatives.”

Andrea Denison, President of RSLREB, noted this move aligns with broader trends across Ontario. “As the industry evolves, amalgamations like this strengthen real estate boards, equipping them to better support REALTORS® in meeting the demands of a changing market.”

The Boards of Directors are enthusiastic about the opportunities this integration presents and look forward to working with Members to shape a brighter future for REALTORS® in Eastern Ontario.

Troy Vaillancourt
Past-President
Cornwall and District Real Estate Board (CDREB)

Erin Finn
President
Kingston and Area Real Estate Association (KAREA)

Curtis Fillier
President
Ottawa Real Estate Board (OREB)

Amanda McParland
President
Renfrew County Real Estate Board (RCREB)

Andrea Denison
President
Rideau St. Lawrence Real Estate Board (RSLREB)

For further information, please contact:

Dani Tedesco-Derouchie, Executive Officer, CDREB, 613-932-6457

Christianne Newton, Chief Executive Officer, KAREA, 613-384-0880 

Nicole Christy, Chief Executive Officer, OREB, 613-225-2240

Amanda McParland, President, RCREB, 613-735-5840

Dani Tedesco-Derouchie, Executive Officer, RSLREB, 613-342-3103

Consumer Confidence Cautiously on the Rise in Ottawa Resale Market

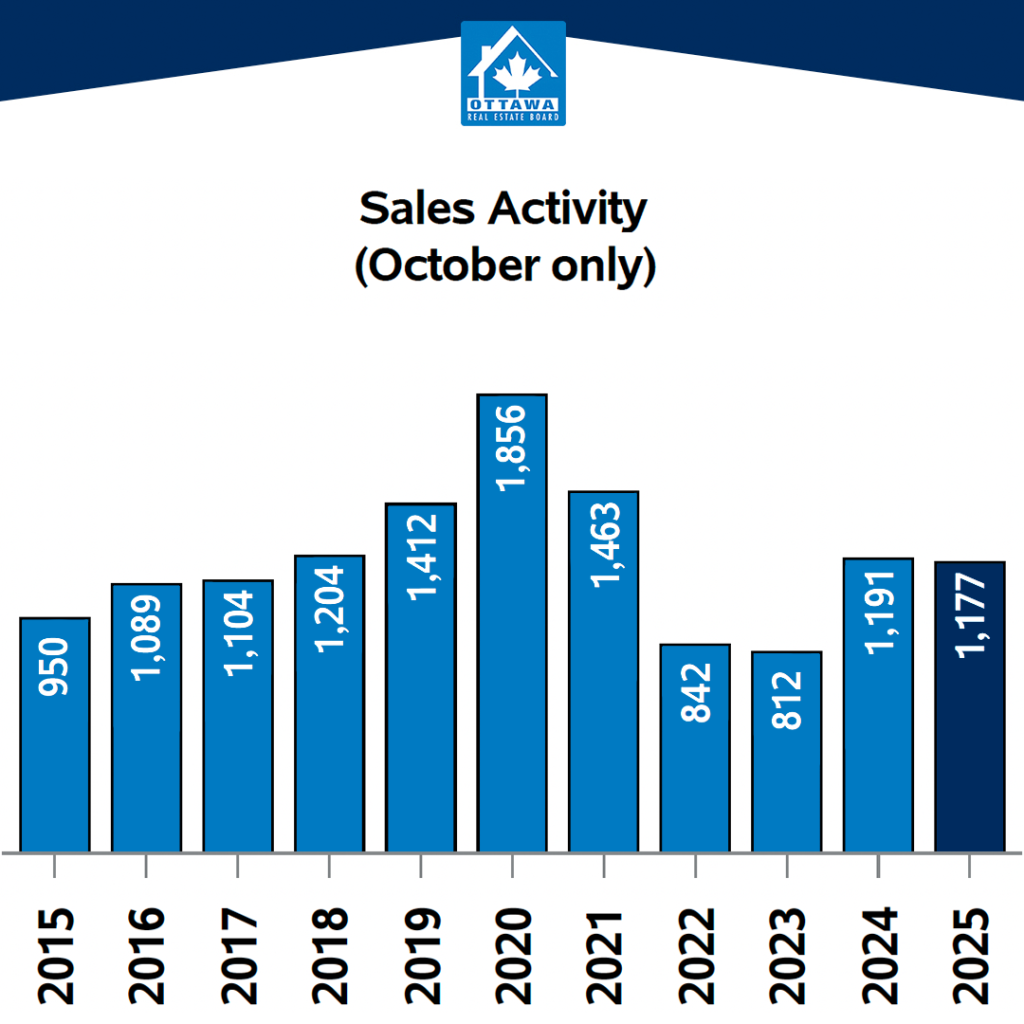
The number of homes sold through the MLS® System of the Ottawa Real Estate Board (OREB) totaled 1,179 units in October 2024 — an increase over the 1,047 units sold last month.

Home sales were 3.9% below the five-year average and 0.9% below the 10-year average for the month of October.

On a year-to-date basis, home sales totaled 11,662 units in October 2024 — an increase of 9.4% from the same period in 2023.

“We’re seeing positive movement in Ottawa’s market with sales activity up,” says OREB President Curtis Fillier. “This is especially interesting because there has been sustained activity throughout the year instead of the typical seasonal spikes and lulls. Consumer confidence is getting stronger, boosted by another consecutive Bank of Canada interest rate cut — though many are waiting for additional rate drops.”

The 50-basis-point reduction might offer optimism following Ontario’s tabling of the Fall Economic Statement where housing starts projections were scaled back to 81,300, representing another reduction in projections and is even further from the province’s goal of creating 125,000 new homes in 2024. The Ontario government cites high interest rates and a tough economic environment as pervasive challenges for homebuilders.

“The challenge remains supply,” says Fillier. “We know from experience that Ottawa’s inventory leans tight and can swing quickly from balanced territory to a seller’s market — which can compound affordability and accessibility challenges. Now is always the time for fresh action and innovative policies that can create much-needed inventory.”

OREB leaders and volunteers recently joined the Canadian Real Estate Association on Parliament Hill to present focused solutions to confront the ongoing housing supply crisis. With expertise and experience in market conditions and consumer needs, REALTORS® advocated to stimulate supply by investing in offsite construction technologies (i.e. prefabricated homes) and extending HST/GST relief for non-profit-built affordable ownership housing.

By the Numbers – Prices: 

The MLS® Home Price Index (HPI) tracks price trends far more accurately than is possible using average or median price measures. 

  • The overall MLS® HPI composite benchmark price was $639,500 in October 2024, an increase of 0.4% from October 2023.
  • The overall MLS® HPI composite benchmark price was $639,500 in October 2024, an increase of 0.4% from October 2023.
    • The benchmark price for single-family homes was $724,500, up 0.7% on a year-over-year basis in October.
    • By comparison, the benchmark price for a townhouse/row unit was $506,900, up 1.6% compared to a year earlier. 
    • The benchmark apartment price was $407,500, down 3.4% from last year.
  • The average price of homes sold in October 2024 was $668,690 increasing 1.2% from October 2023. The more comprehensive year-to-date average price was $678,081, increasing by 0.9% from October 2023.  
  • The dollar volume of all home sales in October 2024 was $788.3 million, up 47.7% from October 2023.

OREB cautions that the average sale price can be useful in establishing trends over time but should not be used as an indicator that specific properties have increased or decreased in value. The calculation of the average sale price is based on the total dollar volume of all properties sold. Prices will vary from neighbourhood to neighbourhood.  

By the Numbers – Inventory & New Listings 

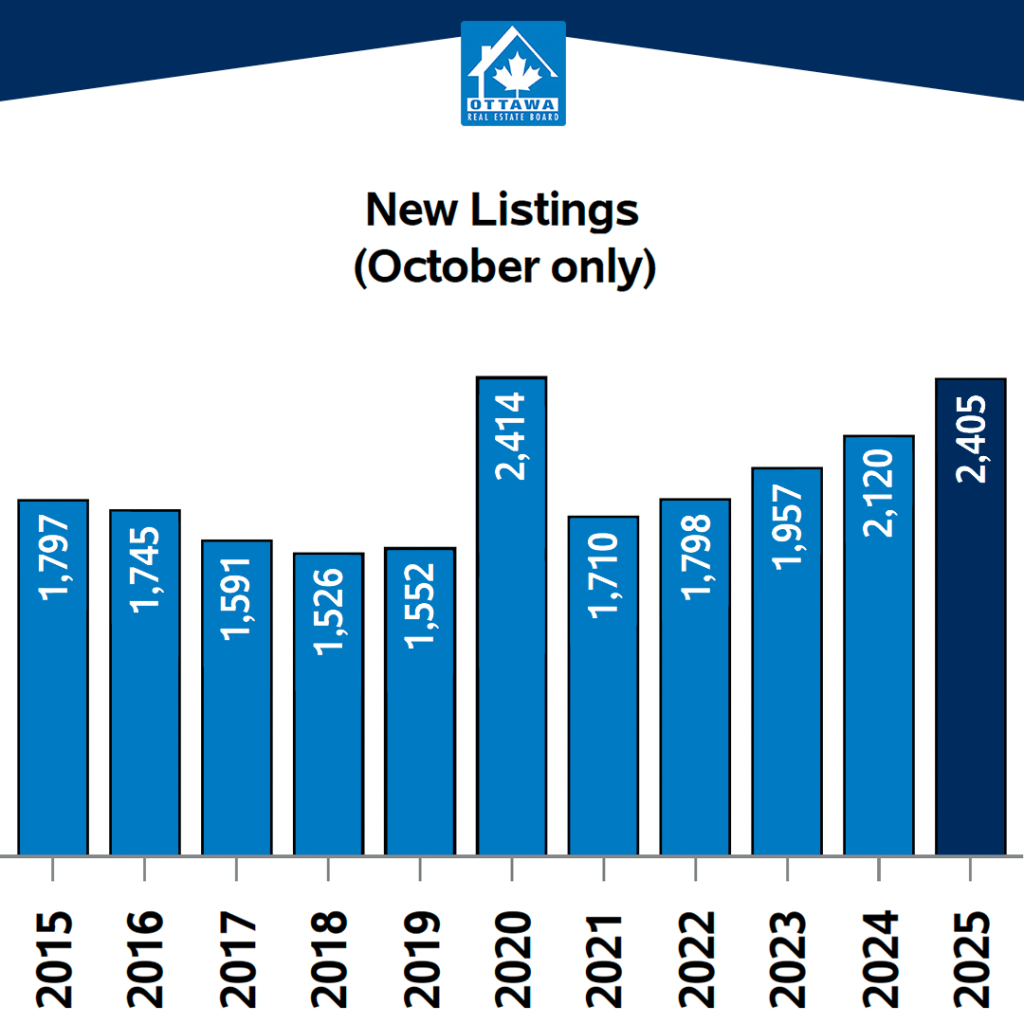
    • The number of new listings saw an increase of 10.4% from October 2023. There were 2,089 new residential listings in October 2024. New listings were 6.7% above the five-year average and 17% above the 10-year average for the month of October.

    • Active residential listings numbered 3,354 units on the market at the end of October 2024, a gain of 8.9% from October 2023. Active listings were 40.6% above the five-year average and 6.7% above the 10-year average for the month of October.

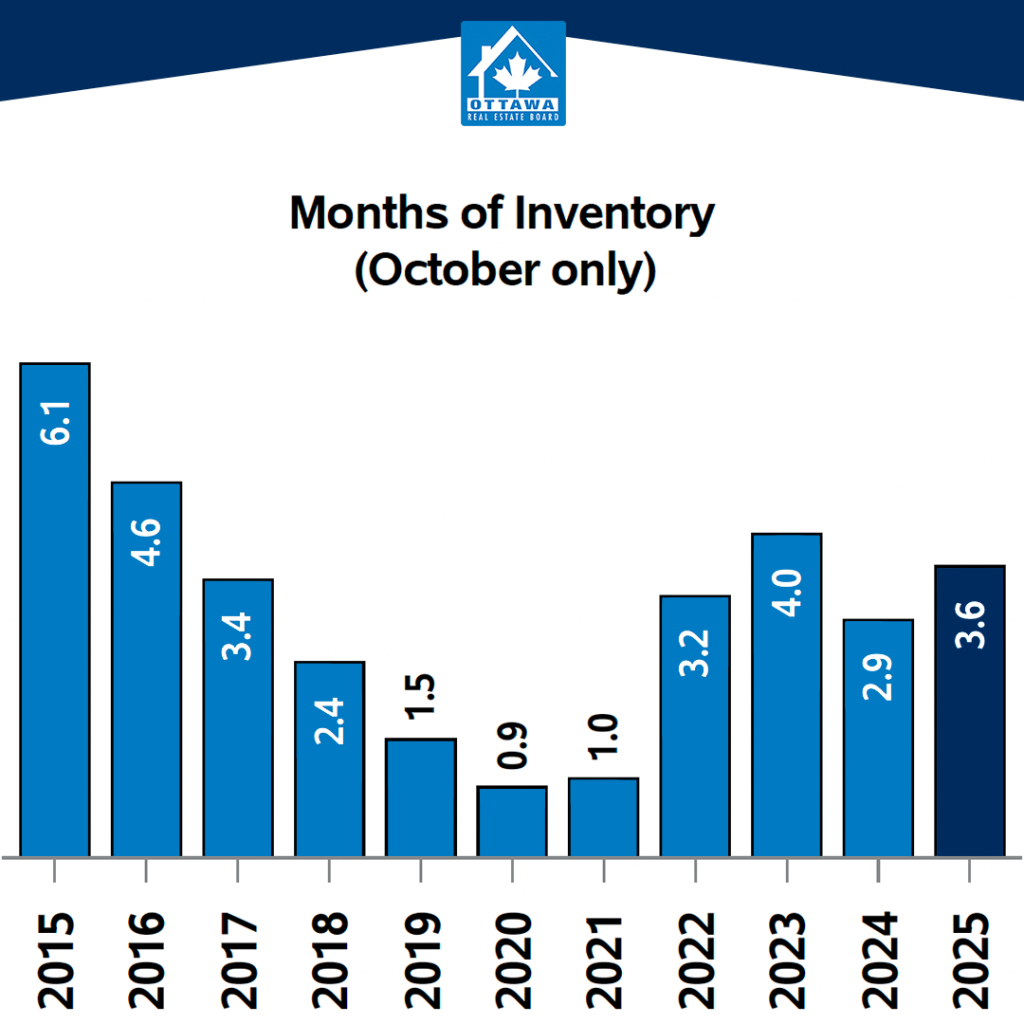
      • Months of inventory numbered 2.8 at the end of October 2024, compared to 3.8 in October 2023. The number of months of inventory is the number of months it would take to sell current inventories at the current rate of sales activity.

Ottawa’s MLS® Home Sales Healthy Amid a Shifting Market

The number of homes sold through the MLS® System of the Ottawa Real Estate Board (OREB) totaled 1,047 units in September 2024. This was an 11.4% increase from September 2023.  

Home sales were 17.4% below the five-year average and 15.4% below the 10-year average for the month of September.  

On a year-to-date basis, home sales totaled 10,485 units in September 2024 — an increase of 6.4% from the same period in 2023.  

“As we navigate a shifting housing market, Ottawa’s fall outlook is healthy,” says OREB President Curtis Fillier. “Activity is robust with an uptick in sales and prices remaining steady. Meanwhile, both buyers and sellers are rethinking their purchasing power amidst news about additional interest rate cuts on the horizon, longer amortizations, and increased price caps for insured mortgages.” 

“There have been encouraging policy developments recently that will stimulate demand,” says Fillier. “But Ottawa’s market does not typically have demand problems — we have chronic supply issues. We’re not building enough homes in the city, and we’re not building enough of the right homes to address the ‘missing middle.’”  

The Canada Mortgage and Housing Corporation (CMHC) recently reported that Ottawa’s “population-adjusted construction is at its lowest level in nearly 10 years.” A City of Ottawa progress report shows that Ottawa is only at 22 per cent of its annual housing target at the end of August.  

By the Numbers – Prices: 

The MLS® Home Price Index (HPI) tracks price trends far more accurately than is possible using average or median price measures. 

  • The overall MLS® HPI composite benchmark price was $642,800 in September 2024, an increase of 0.2% from September 2023.  
    • The benchmark price for single-family homes was $729,000, up 0.5% on a year-over-year basis in September.  
    • By comparison, the benchmark price for a townhouse/row unit was $500,000, down 1.7% compared to a year earlier.  
    • The benchmark apartment price was $414,200, down 1.3% from year-ago levels. 
  • The average price of homes sold in September 2024 was $685,551 increasing 1.4% from September 2023. The more comprehensive year-to-date average price was $679,082, increasing by 0.9% from September 2023.  
  • The dollar volume of all home sales in September 2024 was $717.7 million, up 12.9% from September 2023. 

OREB cautions that the average sale price can be useful in establishing trends over time but should not be used as an indicator that specific properties have increased or decreased in value. The calculation of the average sale price is based on the total dollar volume of all properties sold. Prices will vary from neighbourhood to neighbourhood.  

By the Numbers – Inventory & New Listings 

  • The number of new listings saw an increase of 3.9% from September 2023. There were 2,343 new residential listings in September 2024. New listings were 4.7% above the five-year average and 11.6% above the 10-year average for the month of September. 

  • Active residential listings numbered 3,529 units on the market at the end of September 2024, a gain of 16.9% from September 2023. Active listings were 43.3% above the five-year average and 4.6% above the 10-year average for the month of September. 

  • Months of inventory numbered 3.4 at the end of September 2024, up from 3.2 in September 2023. The number of months of inventory is the number of months it would take to sell current inventories at the current rate of sales activity. 

Ottawa’s Hot Summer Market Expected to Extend into Fall

The number of homes sold through the MLS® System of the Ottawa Real Estate Board (OREB) totaled 1,100 units in August 2024. This was a 10.2% increase from August 2023.

Home sales were 11.4% below the five-year average and 14.1% below the 10-year average for the month of August.

On a year-to-date basis, home sales totaled 9,444 units in August 2024 — an increase of 6.0% from the same period in 2023.

“Being a seasonal market, it’s very encouraging to see sustained levels of activity throughout the whole summer,” says OREB President-elect Paul Czan. “And coupled with a third consecutive interest rate drop from the Bank of Canada, we are anticipating a heated market in the fall.”

“REALTORS® know firsthand how affordability remains a top concern for most buyers. With a stream of new listings hitting the market and prices holding steady, buyers are not moving with urgency. They are still using caution and taking their time to find the right property for their needs and budget. As such, sellers need to be patient and work with a REALTOR® who can use the latest neighbourhood-level data and insights to properly price their property and build a selling strategy.”

By the Numbers – Prices:

The MLS® Home Price Index (HPI) tracks price trends far more accurately than is possible using average or median price measures.

    • The overall MLS® HPI composite benchmark price was $646,000 in August 2024, a decrease of 0.3% from August 2023.
      • The benchmark price for single-family homes was $732,500, down 0.3% on a year-over-year basis in August.
      • By comparison, the benchmark price for a townhouse/row unit was $502,200, up 0.3% compared to a year earlier.
      • The benchmark apartment price was $416,800, down 1.2% from year-ago levels.
    • The average price of homes sold in August 2024 was $660,341 increasing 0.3% from August 2023. The more comprehensive year-to-date average price was $678,327, increasing by 0.9% from August 2023.
    • The dollar volume of all home sales in August 2024 was $726.3 million, up 10.5% from August 2023.

OREB cautions that the average sale price can be useful in establishing trends over time but should not be used as an indicator that specific properties have increased or decreased in value. The calculation of the average sale price is based on the total dollar volume of all properties sold. Prices will vary from neighbourhood to neighbourhood.

By the Numbers – Inventory and New Listings:

      • The number of new listings saw an increase of 0.2% from August 2023. There were 1,907 new residential listings in August 2024. New listings were 0.2% above the five-year average and 0.9% above the 10-year average for the month of August.
      • Active residential listings numbered 3,324 units on the market at the end of August 2024, a gain of 25.8% from August 2023. Active listings were 46.5% above the five-year average and 1.3% below the 10-year average for the month of August.
      • Months of inventory numbered 3.0 at the end of August 2024, up from 2.6 in August 2023. The number of months of inventory is the number of months it would take to sell current inventories at the current rate of sales activity.

Ottawa’s MLS® Market Gains Momentum Heading into Summer

The number of homes sold through the MLS® System of the Ottawa Real Estate Board (OREB) totaled 1,241 units in July 2024. This was a 13.6% increase from July 2023.

Home sales were 7.1% below the five-year average and 8.8% below the 10-year average for the month of July.

On a year-to-date basis, home sales totaled 8,349 units in July 2024 — an increase of 5.5% from the same period in 2023.

“As the market pace typically slows in the summer, July’s activity is encouraging and could be a sign of more gains ahead,” says OREB President Curtis Fillier. “Buyer confidence is slowly but surely catching up while sellers continue to add a steady stream of new listings. Of course, the extent to which that translates into transactions depends on the type of properties and price points available in our communities as supply and affordability issues persist.”

“It’s too early to tell, but recent policy developments could be a boost,” says Fillier. “Two consecutive interest rate cuts by the Bank of Canada, coupled with the federal government’s introduction of 30-year amortization periods on mortgages for first-time homebuyers purchasing newly built homes, will help some buyers. However, these are demand policies and Ottawa — as well as many cities across the country — needs action on the supply side.”

In its Monetary Policy Report, the Bank of Canada points to municipal zoning restrictions and high development fees as long-standing standing challenges to supply growth. Recent data from the Ontario government shows Ottawa is significantly behind its housing starts goal having only built 1,593 homes out of its 12,583 target for 2024. OREB and its member REALTORS® continue to advocate for direct solutions to address the city’s housing crisis, such as allowing four units per lot and reducing costly development fees.

By the Numbers – Prices:

The MLS® Home Price Index (HPI) tracks price trends far more accurately than is possible using average or median price measures.

  • The overall MLS® HPI composite benchmark price was $648,900 in July 2024, an increase of 0.1% from July 2023.
    • The benchmark price for single-family homes was $734,700, down 0.1% on a year-over-year basis in July.
    • By comparison, the benchmark price for a townhouse/row unit was $506,100, up 3.4% compared to a year earlier.
    • The benchmark apartment price was $422,800, down 0.9% from year-ago levels.
  • The average price of homes sold in July 2024 was $679,610 decreasing 2.1% from July 2023. The more comprehensive year-to-date average price was $681,082, increasing by 1.0% from July 2023.
  • The dollar volume of all home sales in July 2024 was $843.3 million, up 11.3% from July 2023.

OREB cautions that the average sale price can be useful in establishing trends over time but should not be used as an indicator that specific properties have increased or decreased in value. The calculation of the average sale price is based on the total dollar volume of all properties sold. Prices will vary from neighbourhood to neighbourhood.

By the Numbers – Inventory & New Listings

  • The number of new listings saw an increase of 17.1% from July 2023. There were 2,231 new residential listings in July 2024. New listings were 6.3% below the five-year average and 6.9% below the 10-year average for the month of July.
  • Active residential listings numbered 3,480 units on the market at the end of July 2024, a gain of 37.0% from July 2023. Active listings were 50.6% above the five-year average and 2.3% below the 10-year average for the month of July.
  • Months of inventory numbered 2.8 at the end of July 2024, up from 2.3 in July 2023. The number of months of inventory is the number of months it would take to sell current inventories at the current rate of sales activity.

Ottawa’s MLS® Activity Builds After Recovering from Prior Slowdown

The number of homes sold through the MLS® System of the Ottawa Real Estate Board (OREB) totaled 1,439 units in June 2024. This was a marginal increase of 0.1% from June 2023.

Home sales were 7.5% below the five-year average and 13.2% below the 10-year average for the month of June.

On a year-to-date basis, home sales totaled 7,109 units over the first half of the year — an increase of 4.2% from the same period in 2023.

“Ottawa continues to see steady activity as we head into the summer market,” says OREB President Curtis Fillier. “Unlike recent years, buyers have more room to wait, evaluate and be selective when searching for the right property at the right price, leading to a slight uptick in the days on market. Sellers are making moves as evidenced by the inventory and listings. After recovering from last year’s slowdown, Ottawa’s market performance is nearly back on par and continues to make gains.

“It’s going to be an interesting summer and next half of the year. As confidence builds, there will be ample opportunities for both parties. Now is the time for sellers to ensure their property is at its best and priced appropriately to attract buyers who remain slightly reluctant. Buyers would do well to remember that inventory levels — and competition — can swing quickly in Ottawa’s tight market.”

By the Numbers – Prices:

The MLS® Home Price Index (HPI) tracks price trends far more accurately than is possible using average or median price measures.

  • The overall MLS® HPI composite benchmark price was $647,700 in June 2024, a decrease of 0.5% from June 2023.
    • The benchmark price for single-family homes was $734,300, down 0.2% on a year-over-year basis in June.
    • By comparison, the benchmark price for a townhouse/row unit was $501,500, down 1.6% compared to a year earlier.
    • The benchmark apartment price was $420,800, down 1.7% from year-ago levels.
  • The average price of homes sold in June 2024 was $686,535 increasing 0.5% from June 2023. The more comprehensive year-to-date average price was $681,345, increasing by 1.6% from the first six months of 2023.
  • The dollar volume of all home sales in June 2024 was $987.9 million, up 0.7% from June 2023.

OREB cautions that the average sale price can be useful in establishing trends over time but should not be used as an indicator that specific properties have increased or decreased in value. The calculation of the average sale price is based on the total dollar volume of all properties sold. Prices will vary from neighbourhood to neighbourhood.

By the Numbers – Inventory & New Listings

  • The number of new listings saw an increase of 4.7% from June 2023. There were 2,469 new residential listings in June 2024. New listings were 0.8% below the five-year average and 1% below the 10-year average for the month of June.
  • Active residential listings numbered 3,585 units on the market at the end of June 2024, a gain of 45.5% from June 2023. Active listings were 57.8% above the five-year average and 1.9% below the 10-year average for the month of June.
  • Months of inventory numbered 2.5 at the end of June 2024, up from 1.7 in June 2023. The number of months of inventory is the number of months it would take to sell current inventories at the current rate of sales activity.

Eastern Ontario Real Estate Boards Exploring Integration

The Cornwall & District Real Estate Board, Kingston and Area Real Estate Association, Ottawa Real Estate Board, Renfrew County Real Estate Board and Rideau-St. Lawrence Real Estate Board are working together to explore regional integration.  

Just as PropTx is being adopted to elevate the resources, tools and data we offer, at the core of this exploration is building value. Our organizations are always working to enhance the services we offer our REALTOR® Members to support their professional needs, help them compete in a changing real estate landscape and help them provide unparalleled service to clients.

Integration is being considered because it could bring the regional boards together to establish more influential and capable organization(s) that can meet significant industry developments head-on while effectively representing local interests. This could be achieved through various options, such as an expansion of existing shared services, a merger with one or more of the existing boards, or amalgamation into a new corporation.

Ultimately, a decision to merge or amalgamate in any way must, and will, be brought to Members of all boards for a vote. A task force made up of representatives from each board has been assembled to ensure good governance while options are examined before being brought to the memberships. Transparency is of the utmost importance, and we commit to keeping all Members informed.

The potential of an integrated organization, and the possibilities of what we can build together are exciting. That said, we want Members and other stakeholders to understand this is a complex process that is being given careful attention, thought and time.

May MLS® Home Sales in Ottawa Smooth and Cautious

The number of homes sold through the MLS® System of the Ottawa Real Estate Board (OREB) totaled 1,545 units in May 2024. This was a decrease of 9.2% from May 2023.

Home sales were 3.7% below the five-year average and 13.2% below the 10-year average for the month of May.

On a year-to-date basis, home sales totaled 5,673 units over the first five months of the year — an increase of 5.2% from the same period in 2023.

“Ottawa’s early spring market was unsurprisingly steady,” says OREB President Curtis Fillier. “The increase in new listings indicate that sellers are more confident that properties are moving as more activity returns to the market. Some sellers, however, were likely waiting for the Bank of Canada’s interest rate announcement to see if it would affect their purchasing power. The first interest rate cut in four years is good news, but expectations still need to be managed as long as supply issues and high home prices persist.”

“Interest rate cuts, for example, can’t help get more homes built and make them affordable when the City of Ottawa is hiking development fees — a counterproductive move that OREB is firmly against.”

By the Numbers – Prices:

The MLS® Home Price Index (HPI) tracks price trends far more accurately than is possible using average or median price measures.

  • The overall MLS® HPI composite benchmark price was $651,300 in May 2024, a marginal gain of 1.2% from May 2023.
    • The benchmark price for single-family homes was $736,000, up 1.1% on a year-over-year basis in May.
    • By comparison, the benchmark price for a townhouse/row unit was $517,500, up 2.1% compared to a year earlier.
    • The benchmark apartment price was $425,000, up 2.0% from year-ago levels.
    • The average price of homes sold in May 2024 was $690,683 increasing 0.8% from May 2023. The more comprehensive year-to-date average price was $679,862, increasing by 1.8% from the first five months of 2023.
  • The dollar volume of all home sales in May 2024 was $1.06 billion, down 8.5% from the same month in 2023.

OREB cautions that the average sale price can be useful in establishing trends over time but should not be used as an indicator that specific properties have increased or decreased in value. The calculation of the average sale price is based on the total dollar volume of all properties sold. Prices will vary from neighbourhood to neighbourhood.

By the Numbers – Inventory & New Listings

  • The number of new listings saw an increase of 26.2% from May 2023. There were 3,034 new residential listings in May 2024. New listings were 23.2% above the five-year average and 10.2% above the 10-year average for the month of May.
  • Active residential listings numbered 3,552 units on the market at the end of May 2024, a gain of 59.4% from May 2023. Active listings were 72.2% above the five-year average and 2.9% below the 10-year average for the month of May.
  • Months of inventory numbered 2.3 at the end of May 2024, up from 1.3 in May 2023. The number of months of inventory is the number of months it would take to sell current inventories at the current rate of sales activity.

More News from OREB

Welcome, Nicole Christy!

On June 3, 2024, OREB welcomed a new CEO, Nicole Christy. Nicole joins OREB from the London and St. Thomas Association of REALTORS® (LSTAR) where she rose to the position of Vice-President, Corporate Governance and Leadership Development.

“It’s a pivotal time in a rapidly evolving industry, but our mission remains steadfast: for OREB and its REALTOR® Members to be respected as the leading authority on real estate matters,” says Christy. “I know I’m joining an exceptional team and I look forward to working with everyone to bring our Members new tools and services that will elevate their practice and the value they offer to clients — including new technologies that facilitate barrier-free access to province-wide listing and property data.”

Nicole joined LSTAR in 2021 after several years working on housing policy and providing government relations support to some of Canada’s leading national associations, including the Canadian Real Estate Association (CREA), the Federation of Canadian Municipalities, and the Canadian Home Builders’ Association.

Swing and a hit!

Ottawa REALTORS® took to the greens on May 30, 2024, for OREB’s Annual Charity Golf Tournament, helping to raise an impressive $24,206.25. Through the Ontario REALTORS Care® Foundation, 100% of the funds raised will be donated to local shelter-related charities that provide a refuge, haven, or other type of protection from the effects of hunger, the elements, abuse, disabilities, and illness. In 2023, OREB donated more than $117,000 to local charities thanks to events such as the annual golf tournament and other fundraising initiatives.