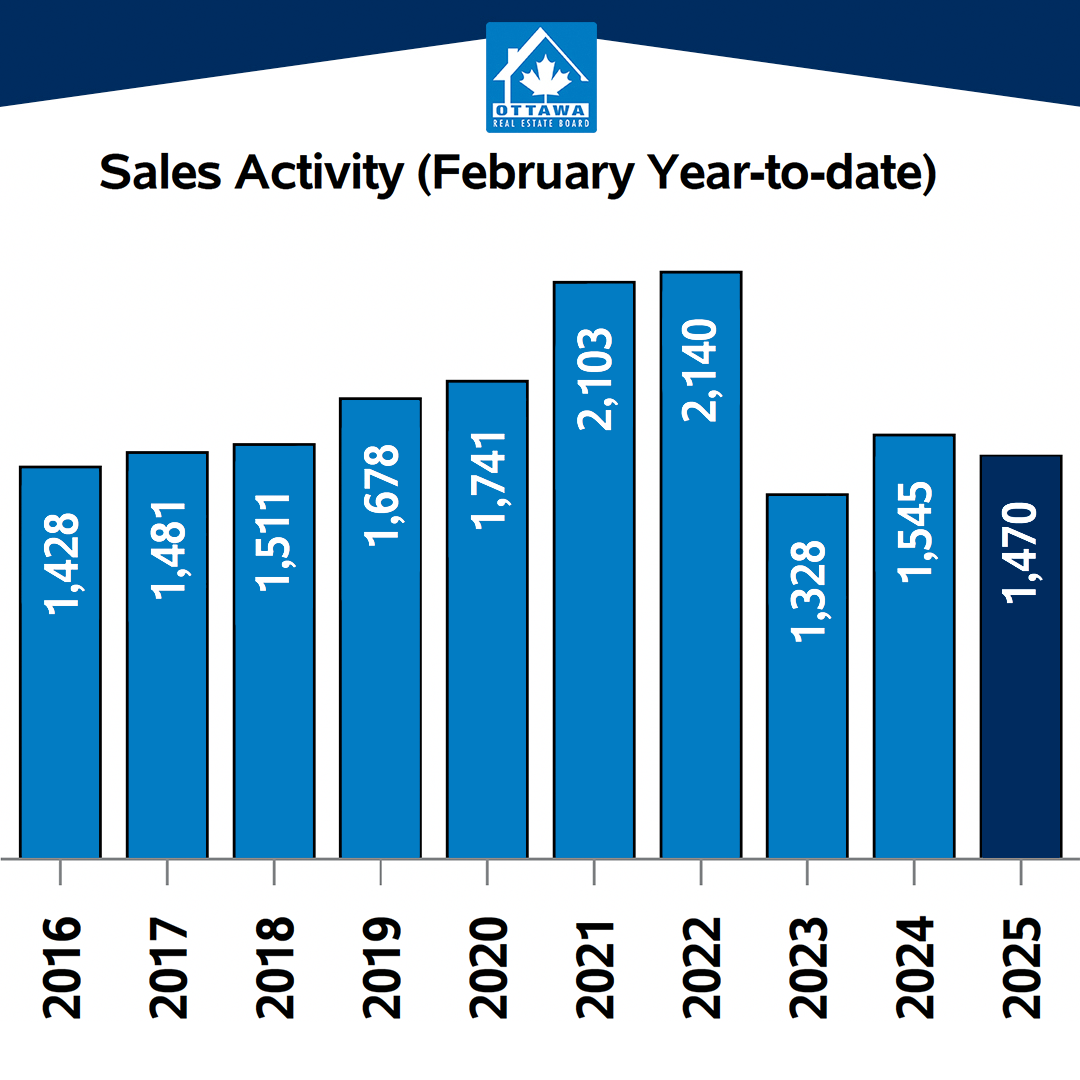
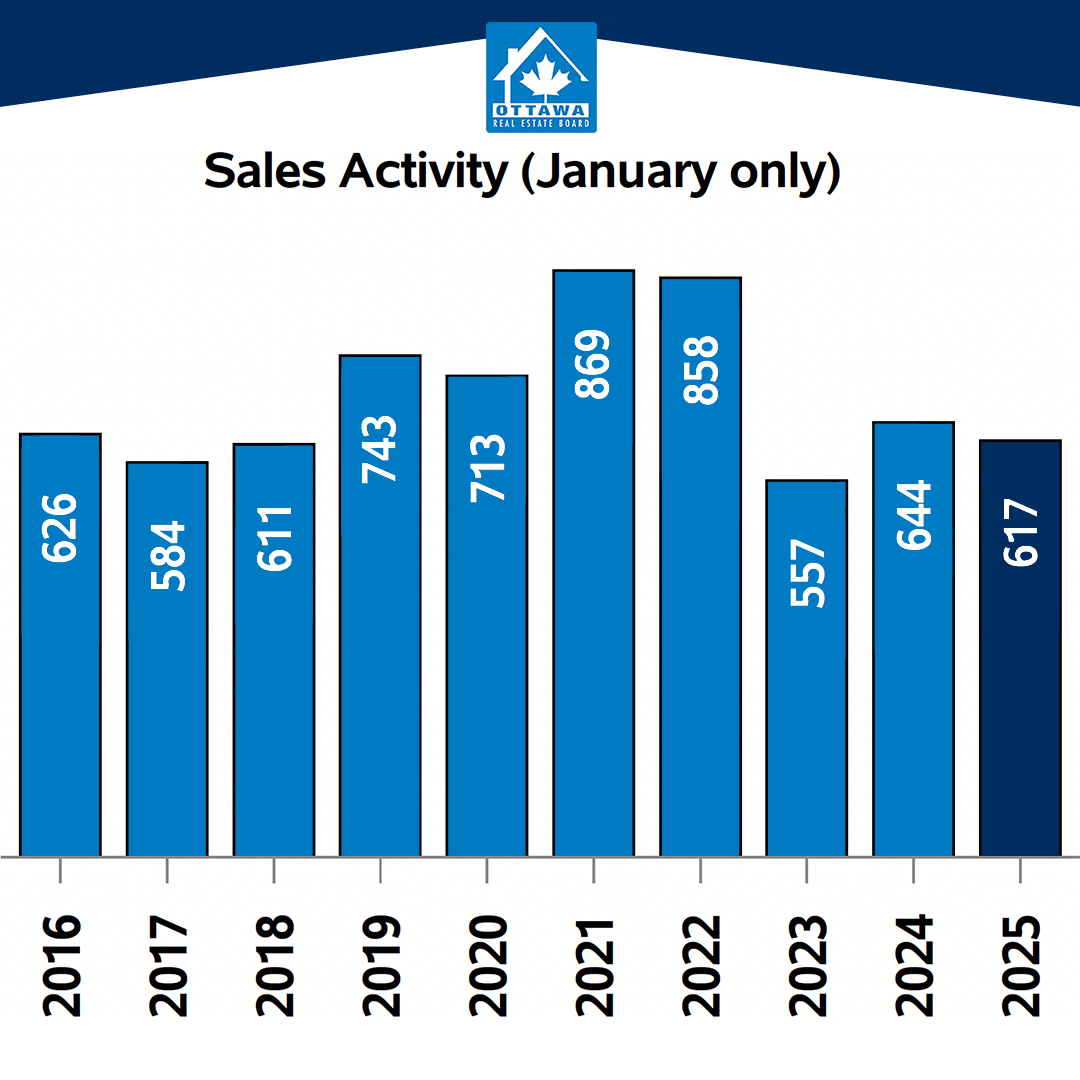
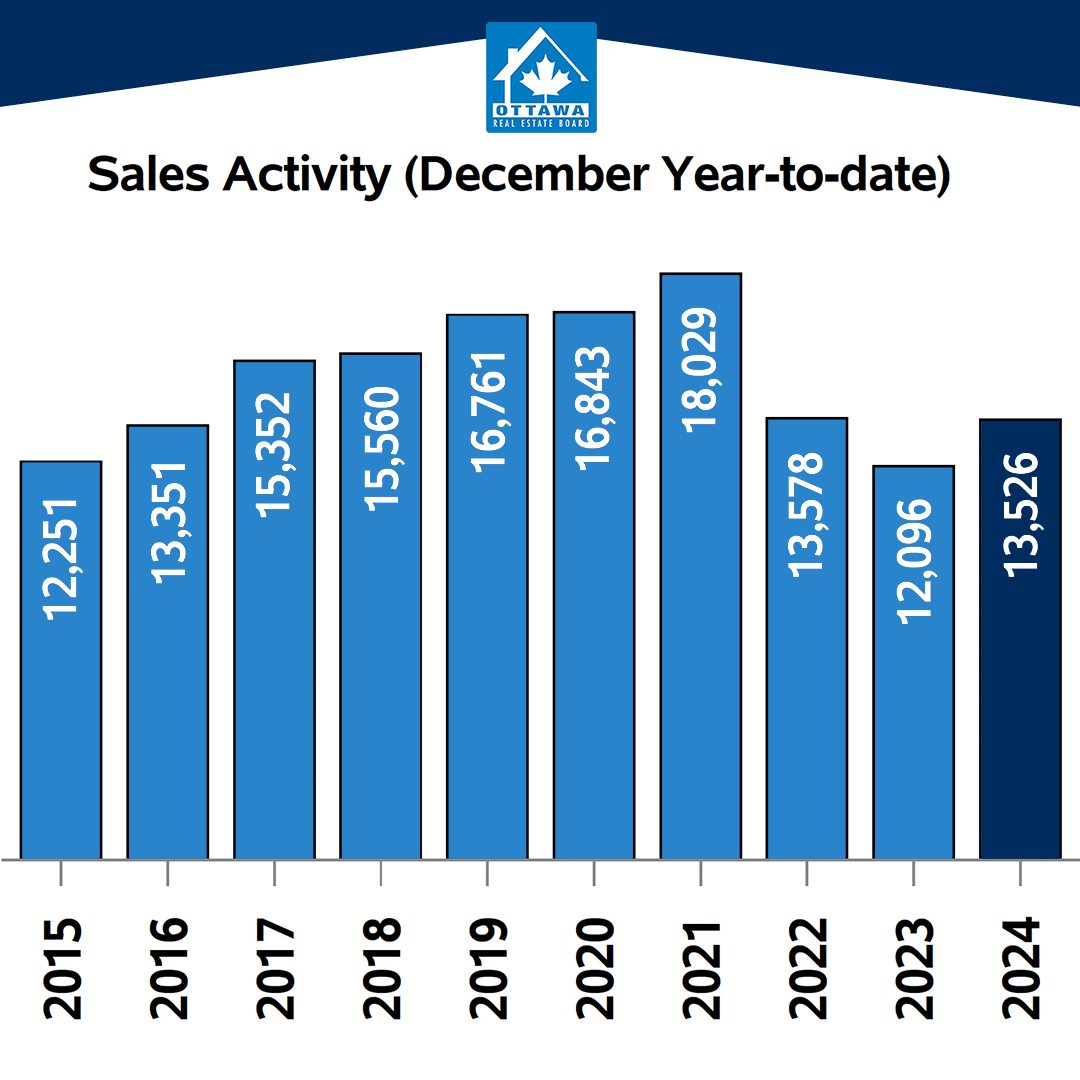
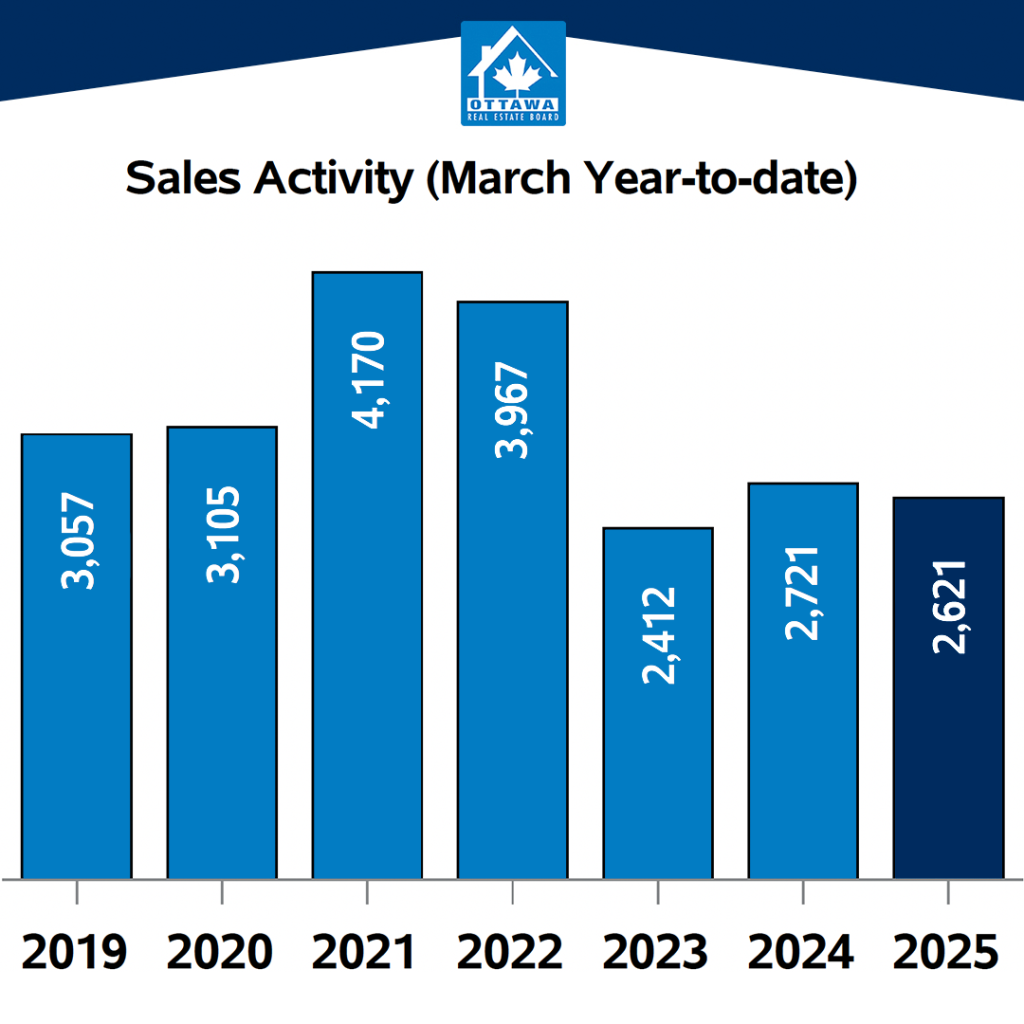
The number of homes sold through the MLS® System of the Ottawa Real Estate Board (OREB) totaled 1,103 units in March 2025. This represented a 6.2% decline from March 2024.
Home sales were 24% below the five-year average and 19.3% below the 10-year average for the month of March.
“The Ottawa housing market in March 2025 remained relatively stable, with sales activity slightly lower than the same period last year,” said OREB President Paul Czan. “However, we’re seeing continued momentum month-over-month as the spring market gains traction. Both buyers and sellers are exercising some caution—likely due to economic uncertainty and the upcoming election—but the current lower interest rates are encouraging more activity as they step off the sidelines.”
“Looking ahead, the ongoing trade and tariff concerns could affect new construction and further exacerbate supply challenges,” Czan adds. “So, it’s critical that the City of Ottawa continues collaborating with key stakeholders. We were pleased to take part in discussions around the proposed New Zoning By-Law, which prioritizes housing options and opportunities to maximize options for Ottawa’s residents.”
By the Numbers – Prices:
- The overall MLS® HPI composite benchmark price was $626,200 in March 2025, a 2.2% rise compared to March 2024.
- The benchmark price for single-family homes was $698,700, up 2.7% year-over-year in March.
- By comparison, the benchmark price for a townhouse/row unit was $431,200, an increase of 3.0% from 2024.
- The benchmark apartment price was $400,900, a 4.3% decline from the previous year.
- The average price of homes sold in March 2025 was $685,866, unchanged from March 2024.
- The total dollar volume of all home sales in March 2025 amounted to $756.5 million, a 6.2% drop compared to the same period last year.
By the Numbers – Inventory & New Listings:
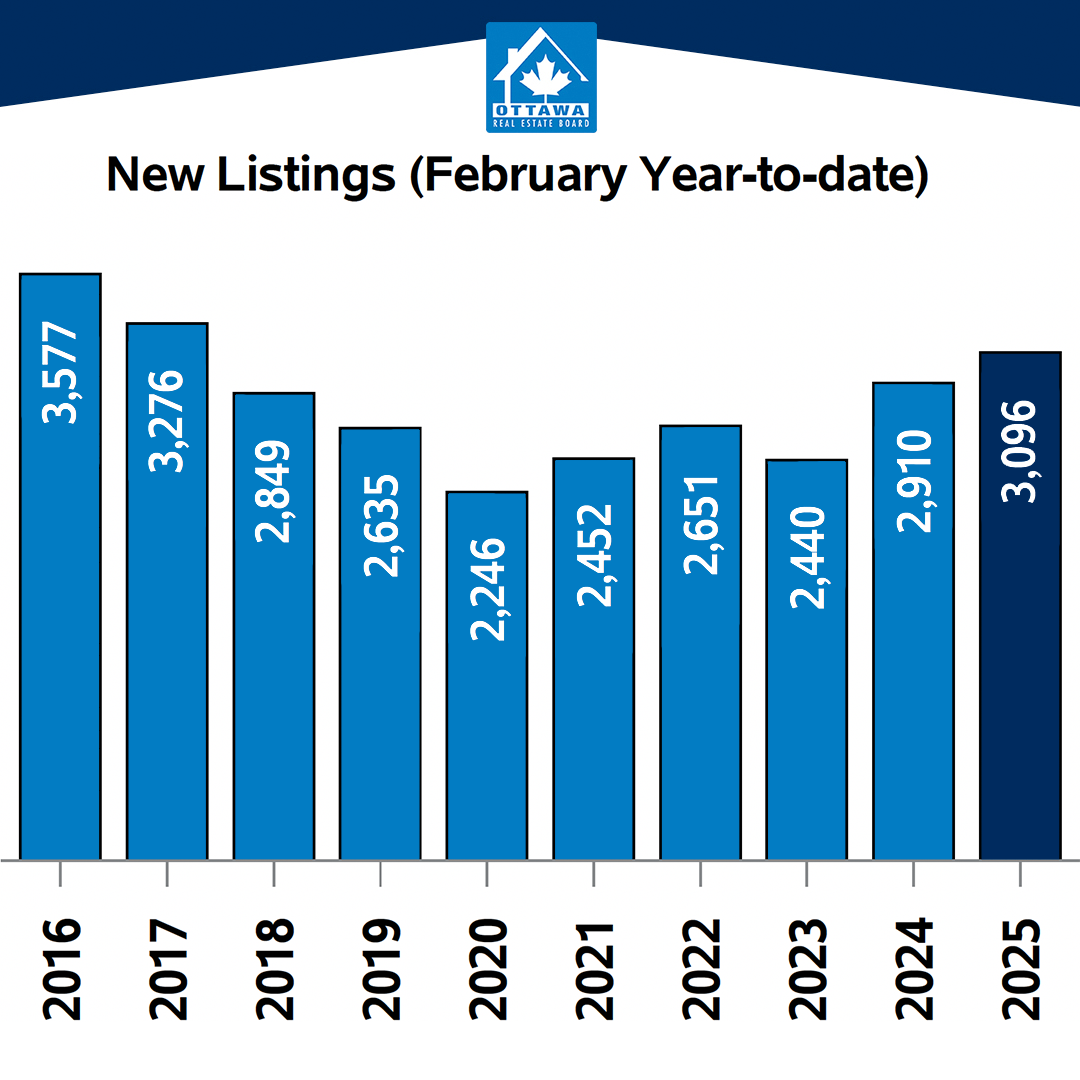
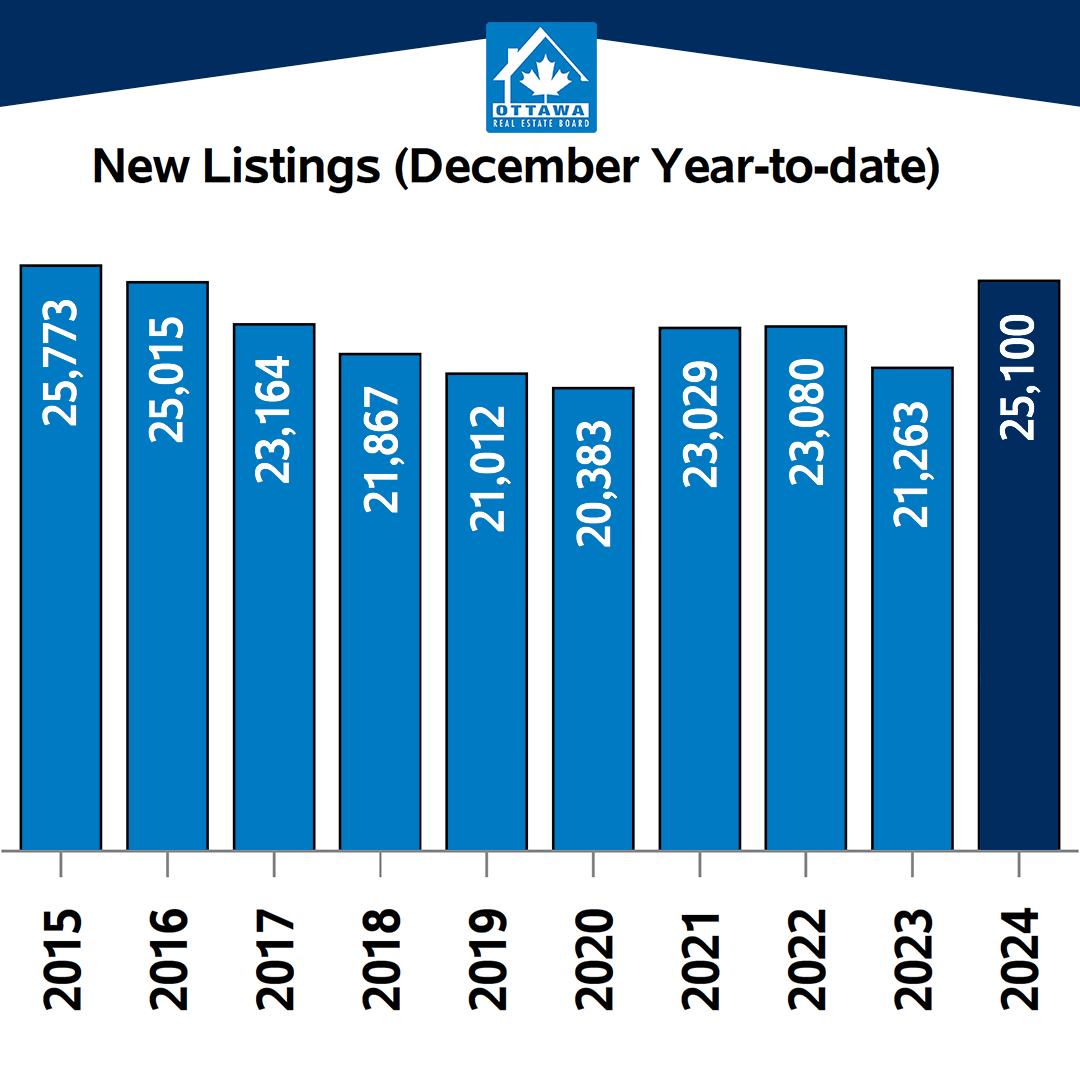
- The number of new listings rose by 4.1% compared to March 2024, with 2,221 new residential properties added to the market. New listings were 0.7% below the five-year average and 2.2% below the 10-year average for the month of March.
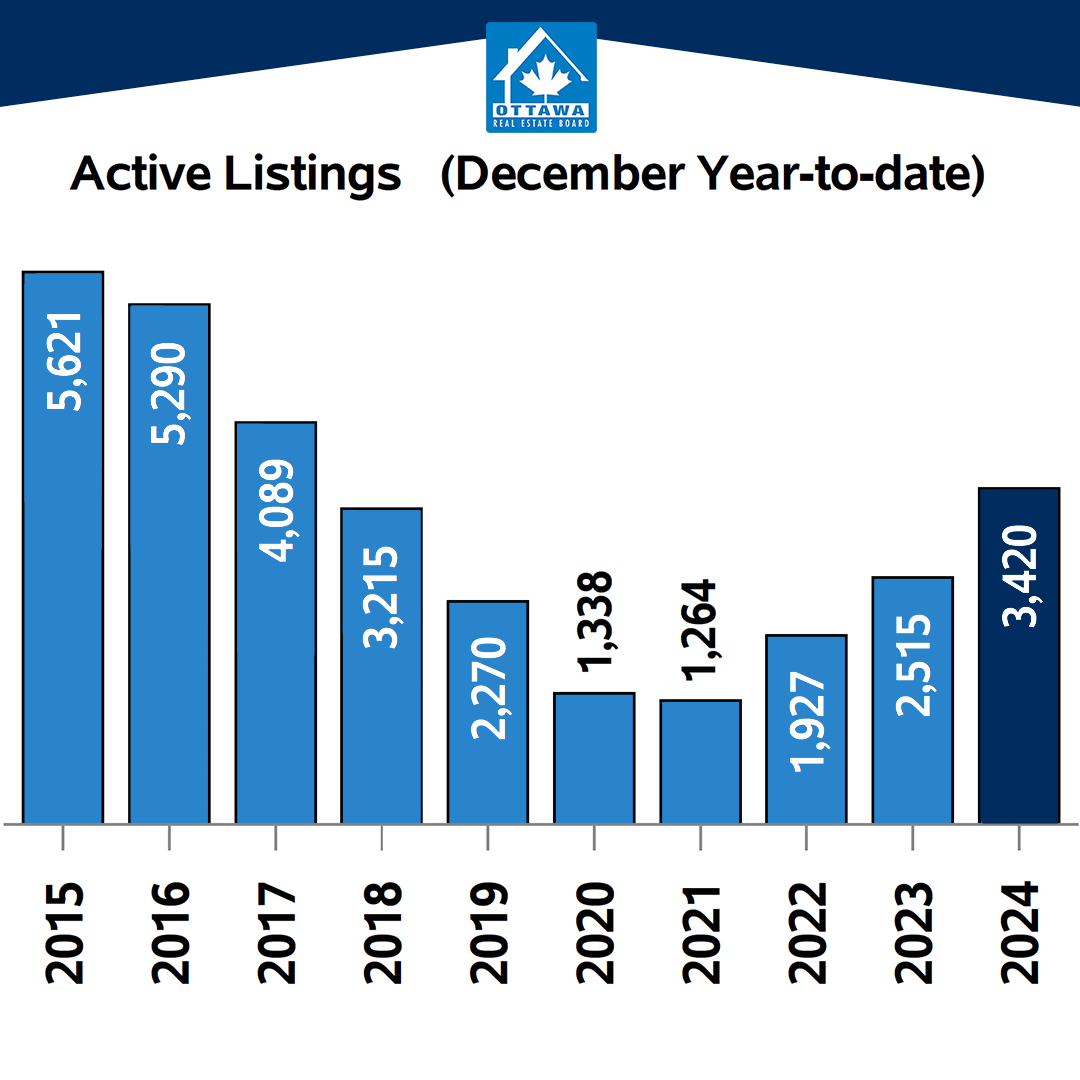
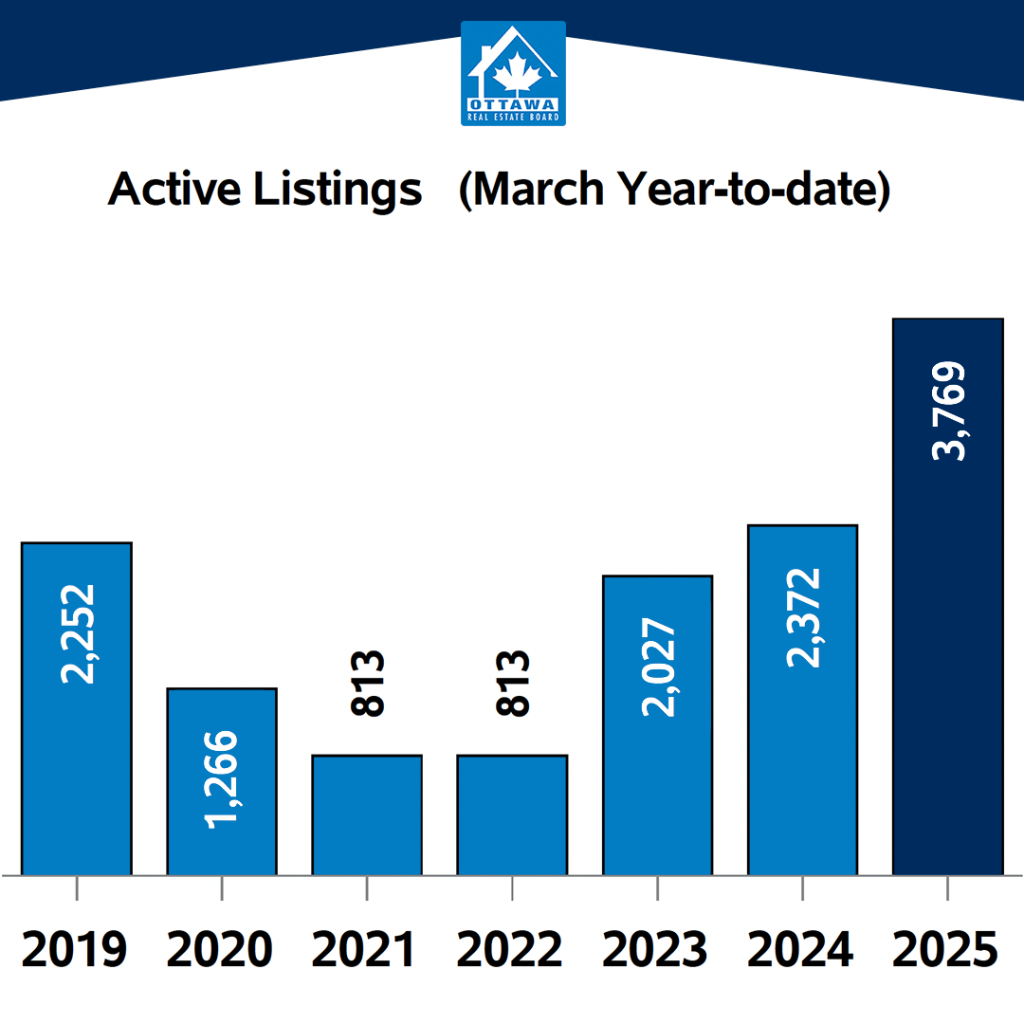
- Active residential listings totaled 4,319 units at the end of March 2025, reflecting a substantial 60.3% surge from March 2024. Active listings were 92.7% above the five-year average and 49.5% above the 10-year average for the month of March.
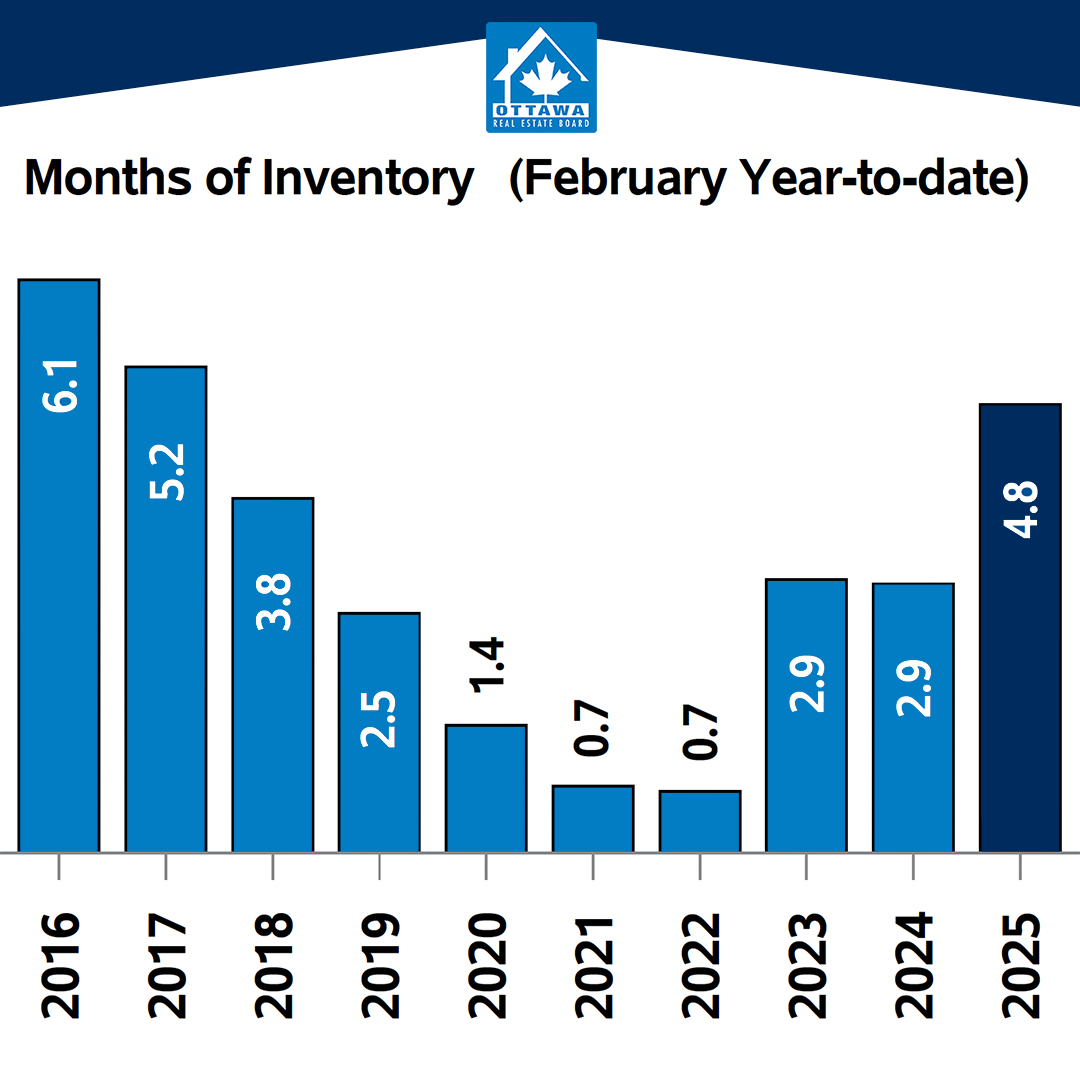
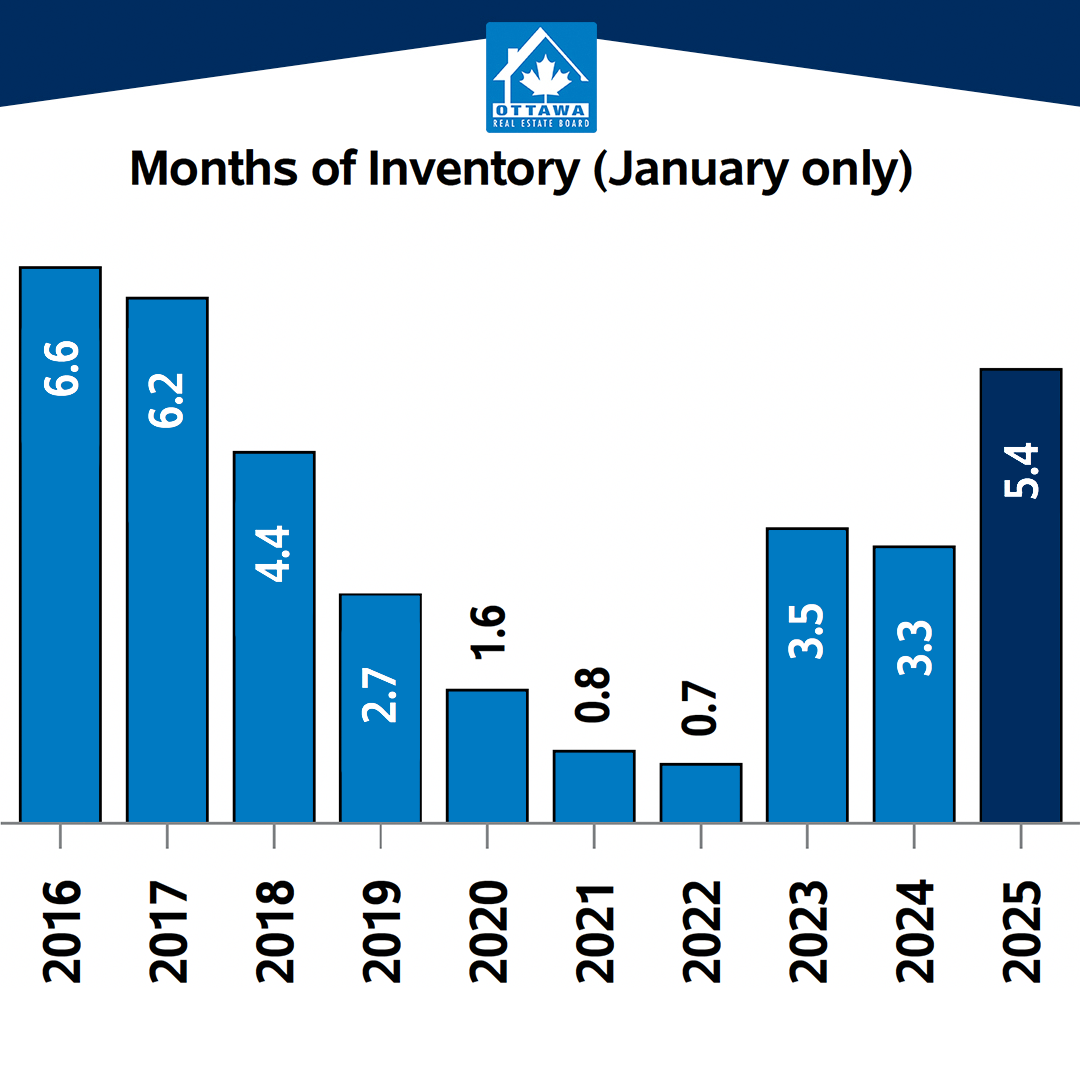
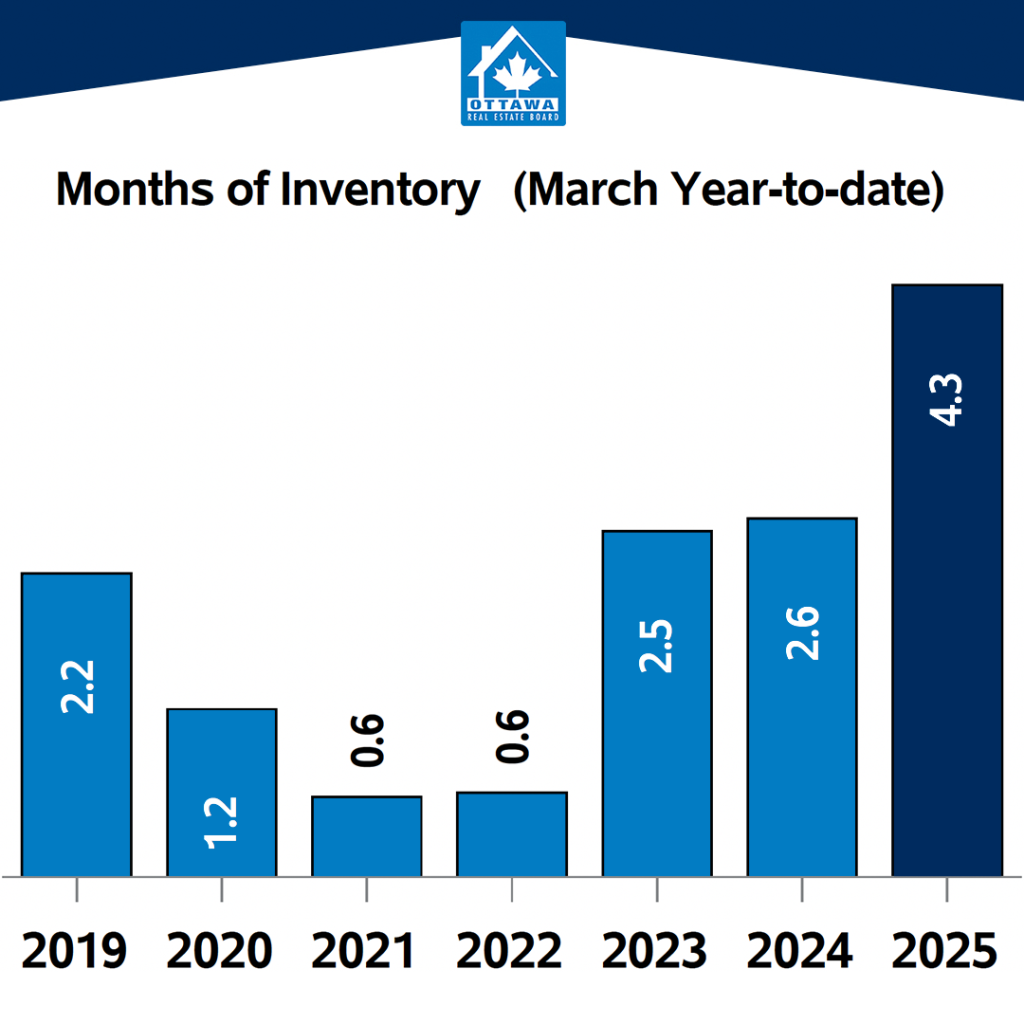
- Months of inventory stood at 3.9 at the end of March 2025, compared to 2.3 in March 2024. The number of months of inventory is the number of months it would take to sell current inventories at the current rate of sales activity.