Ottawa’s MLS® Home Sales Healthy Amid a Shifting Market
October 7, 2024
The number of homes sold through the MLS® System of the Ottawa Real Estate Board (OREB) totaled 1,047 units in September 2024. This was an 11.4% increase from September 2023.
Home sales were 17.4% below the five-year average and 15.4% below the 10-year average for the month of September.
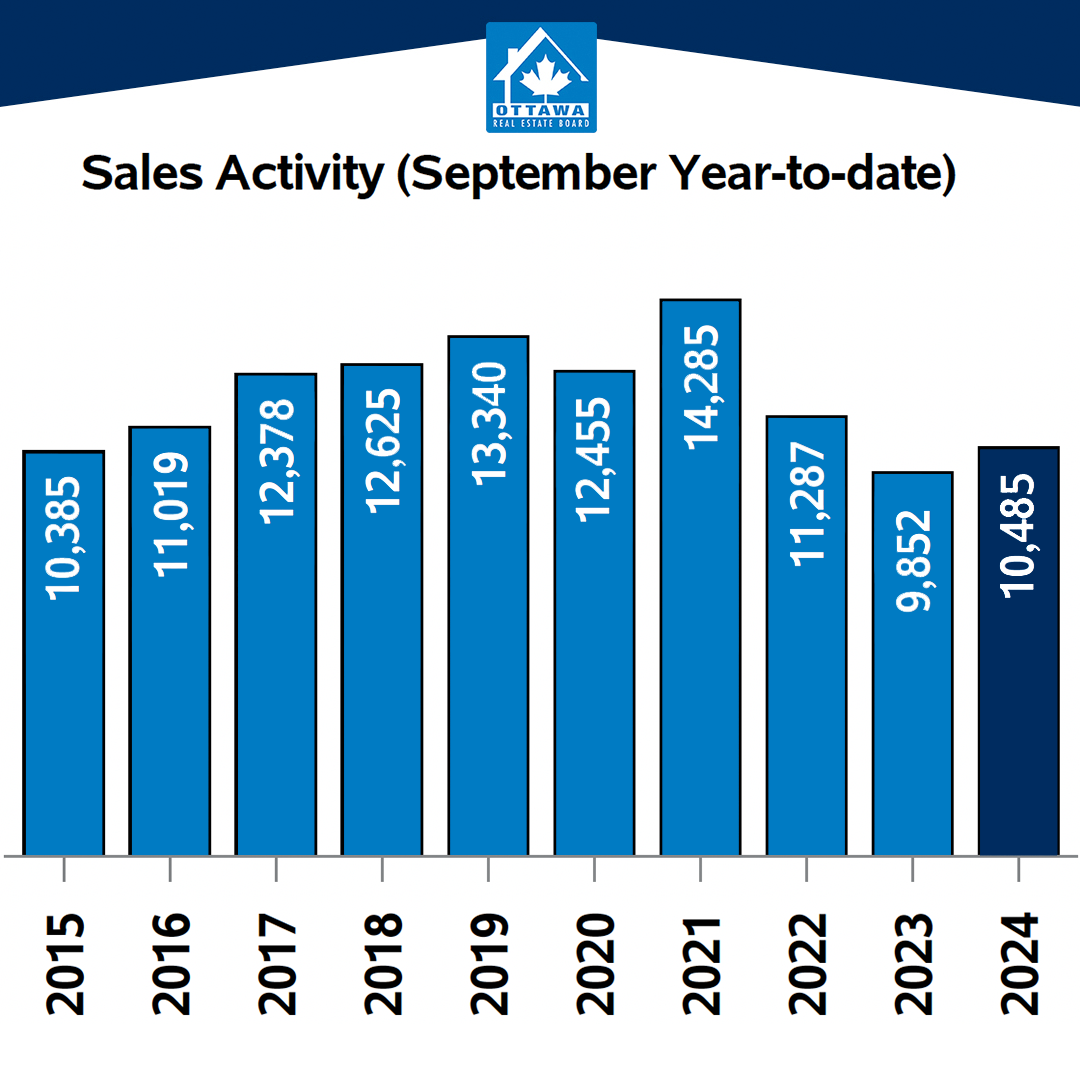
On a year-to-date basis, home sales totaled 10,485 units in September 2024 — an increase of 6.4% from the same period in 2023.
“As we navigate a shifting housing market, Ottawa’s fall outlook is healthy,” says OREB President Curtis Fillier. “Activity is robust with an uptick in sales and prices remaining steady. Meanwhile, both buyers and sellers are rethinking their purchasing power amidst news about additional interest rate cuts on the horizon, longer amortizations, and increased price caps for insured mortgages.”
“There have been encouraging policy developments recently that will stimulate demand,” says Fillier. “But Ottawa’s market does not typically have demand problems — we have chronic supply issues. We’re not building enough homes in the city, and we’re not building enough of the right homes to address the ‘missing middle.’”
The Canada Mortgage and Housing Corporation (CMHC) recently reported that Ottawa’s “population-adjusted construction is at its lowest level in nearly 10 years.” A City of Ottawa progress report shows that Ottawa is only at 22 per cent of its annual housing target at the end of August.
By the Numbers – Prices:
The MLS® Home Price Index (HPI) tracks price trends far more accurately than is possible using average or median price measures.
- The overall MLS® HPI composite benchmark price was $642,800 in September 2024, an increase of 0.2% from September 2023.
- The benchmark price for single-family homes was $729,000, up 0.5% on a year-over-year basis in September.
- By comparison, the benchmark price for a townhouse/row unit was $500,000, down 1.7% compared to a year earlier.
- The benchmark apartment price was $414,200, down 1.3% from year-ago levels.
- The average price of homes sold in September 2024 was $685,551 increasing 1.4% from September 2023. The more comprehensive year-to-date average price was $679,082, increasing by 0.9% from September 2023.
- The dollar volume of all home sales in September 2024 was $717.7 million, up 12.9% from September 2023.
OREB cautions that the average sale price can be useful in establishing trends over time but should not be used as an indicator that specific properties have increased or decreased in value. The calculation of the average sale price is based on the total dollar volume of all properties sold. Prices will vary from neighbourhood to neighbourhood.
By the Numbers – Inventory & New Listings
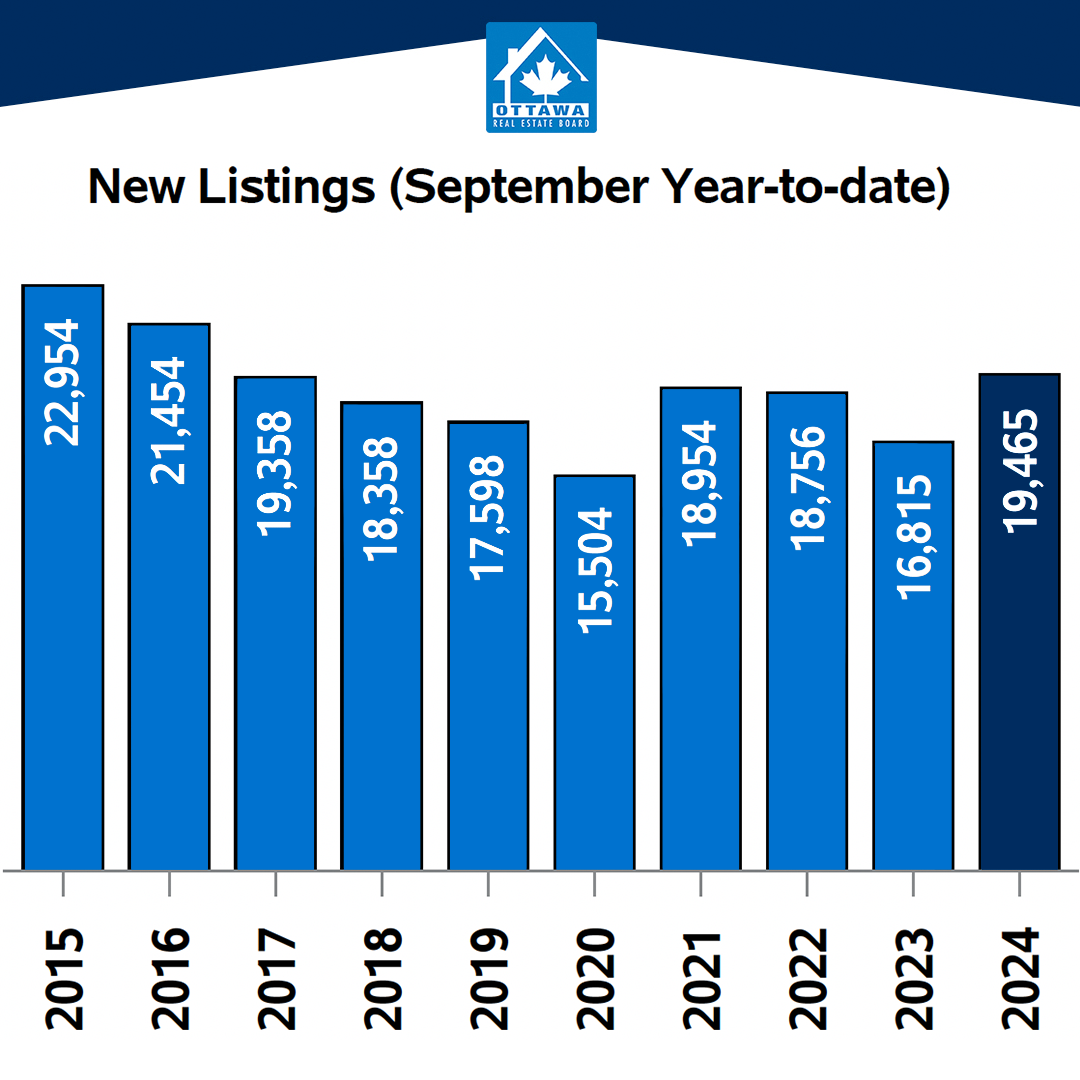
- The number of new listings saw an increase of 3.9% from September 2023. There were 2,343 new residential listings in September 2024. New listings were 4.7% above the five-year average and 11.6% above the 10-year average for the month of September.
- Active residential listings numbered 3,529 units on the market at the end of September 2024, a gain of 16.9% from September 2023. Active listings were 43.3% above the five-year average and 4.6% above the 10-year average for the month of September.
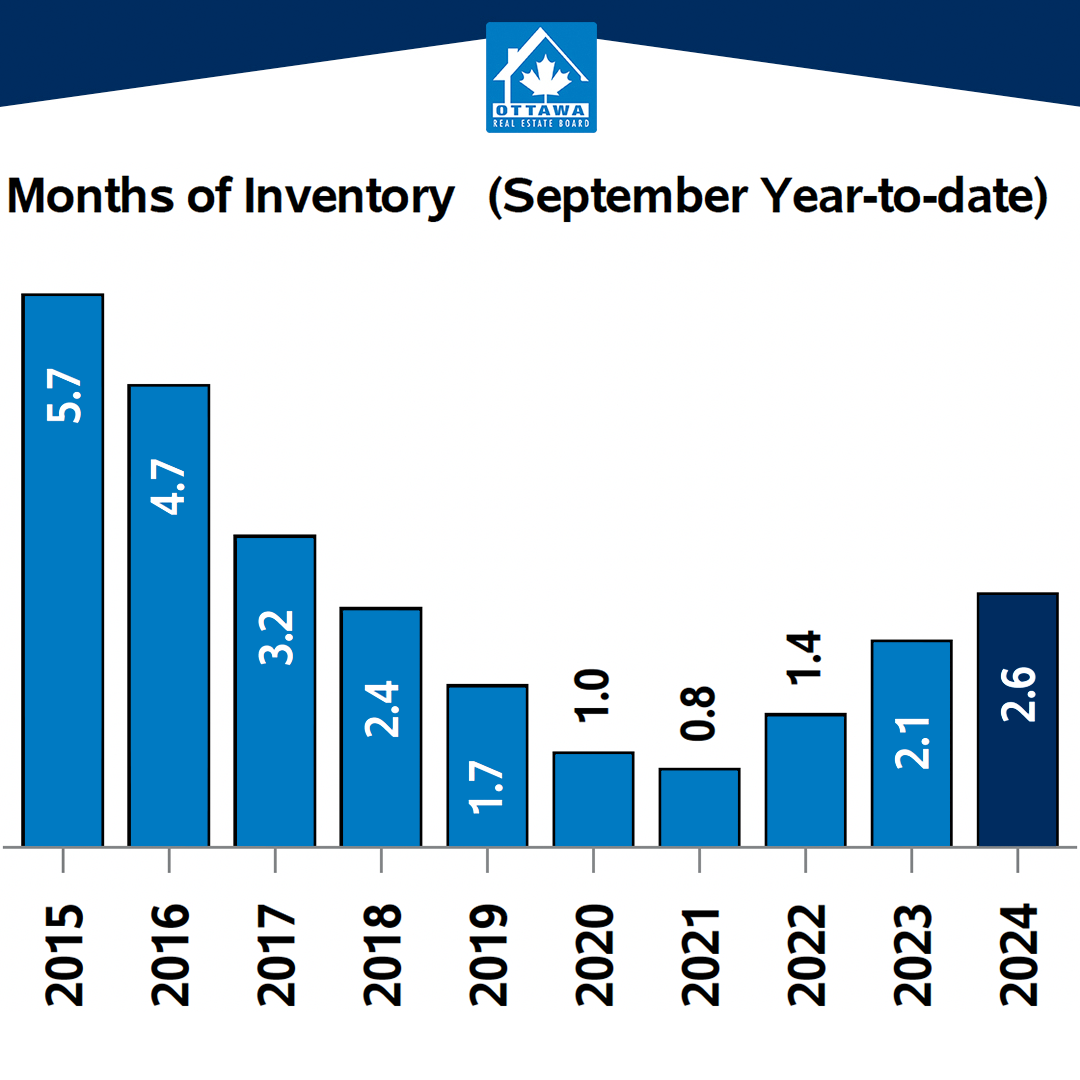
- Months of inventory numbered 3.4 at the end of September 2024, up from 3.2 in September 2023. The number of months of inventory is the number of months it would take to sell current inventories at the current rate of sales activity.