Ottawa’s Hot Summer Market Expected to Extend into Fall
September 5, 2024
The number of homes sold through the MLS® System of the Ottawa Real Estate Board (OREB) totaled 1,100 units in August 2024. This was a 10.2% increase from August 2023.
Home sales were 11.4% below the five-year average and 14.1% below the 10-year average for the month of August.
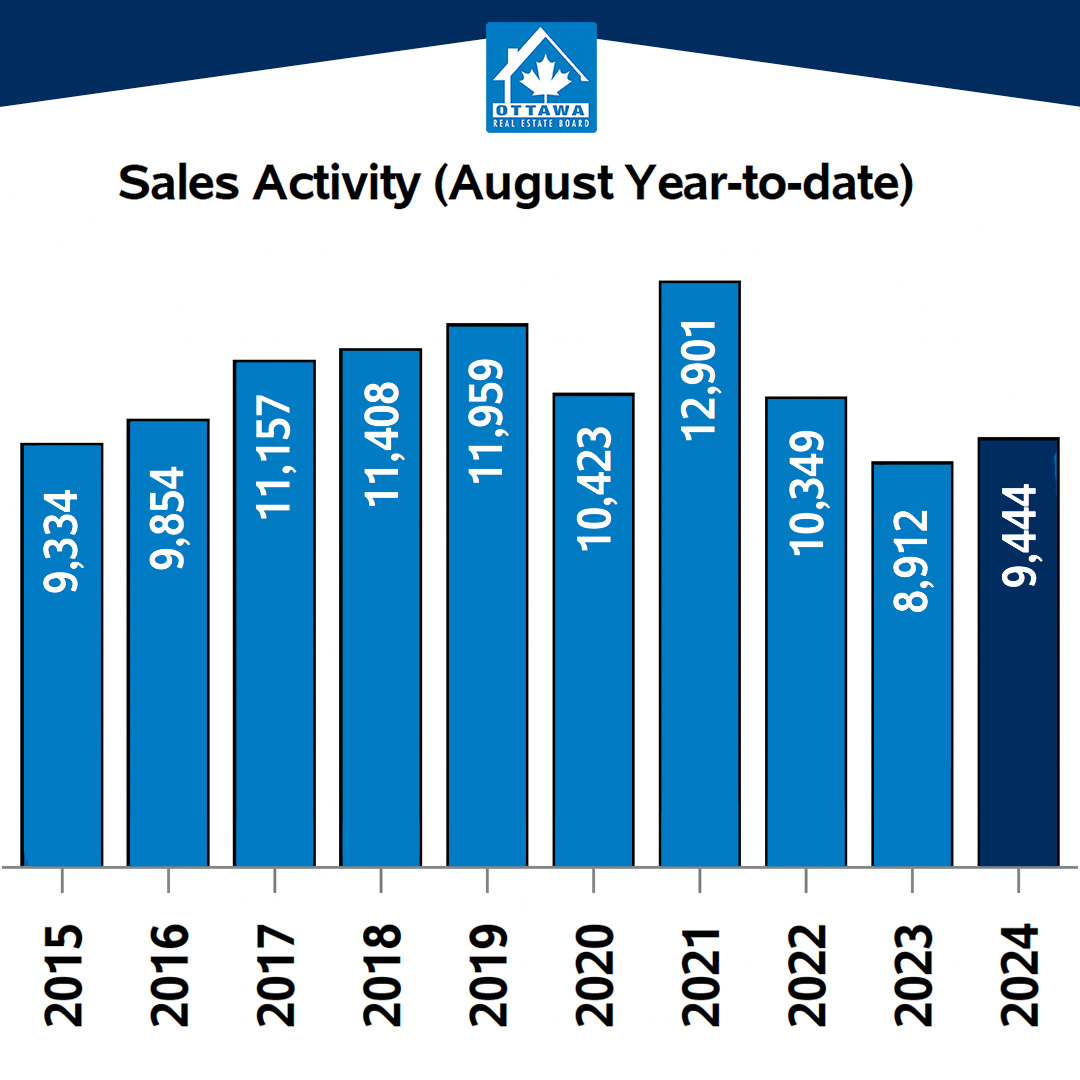
On a year-to-date basis, home sales totaled 9,444 units in August 2024 — an increase of 6.0% from the same period in 2023.
“Being a seasonal market, it’s very encouraging to see sustained levels of activity throughout the whole summer,” says OREB President-elect Paul Czan. “And coupled with a third consecutive interest rate drop from the Bank of Canada, we are anticipating a heated market in the fall.”
“REALTORS® know firsthand how affordability remains a top concern for most buyers. With a stream of new listings hitting the market and prices holding steady, buyers are not moving with urgency. They are still using caution and taking their time to find the right property for their needs and budget. As such, sellers need to be patient and work with a REALTOR® who can use the latest neighbourhood-level data and insights to properly price their property and build a selling strategy.”
By the Numbers – Prices:
The MLS® Home Price Index (HPI) tracks price trends far more accurately than is possible using average or median price measures.
-
- The overall MLS® HPI composite benchmark price was $646,000 in August 2024, a decrease of 0.3% from August 2023.
- The benchmark price for single-family homes was $732,500, down 0.3% on a year-over-year basis in August.
- By comparison, the benchmark price for a townhouse/row unit was $502,200, up 0.3% compared to a year earlier.
- The benchmark apartment price was $416,800, down 1.2% from year-ago levels.
- The average price of homes sold in August 2024 was $660,341 increasing 0.3% from August 2023. The more comprehensive year-to-date average price was $678,327, increasing by 0.9% from August 2023.
- The dollar volume of all home sales in August 2024 was $726.3 million, up 10.5% from August 2023.
- The overall MLS® HPI composite benchmark price was $646,000 in August 2024, a decrease of 0.3% from August 2023.
OREB cautions that the average sale price can be useful in establishing trends over time but should not be used as an indicator that specific properties have increased or decreased in value. The calculation of the average sale price is based on the total dollar volume of all properties sold. Prices will vary from neighbourhood to neighbourhood.
By the Numbers – Inventory and New Listings:
-
-
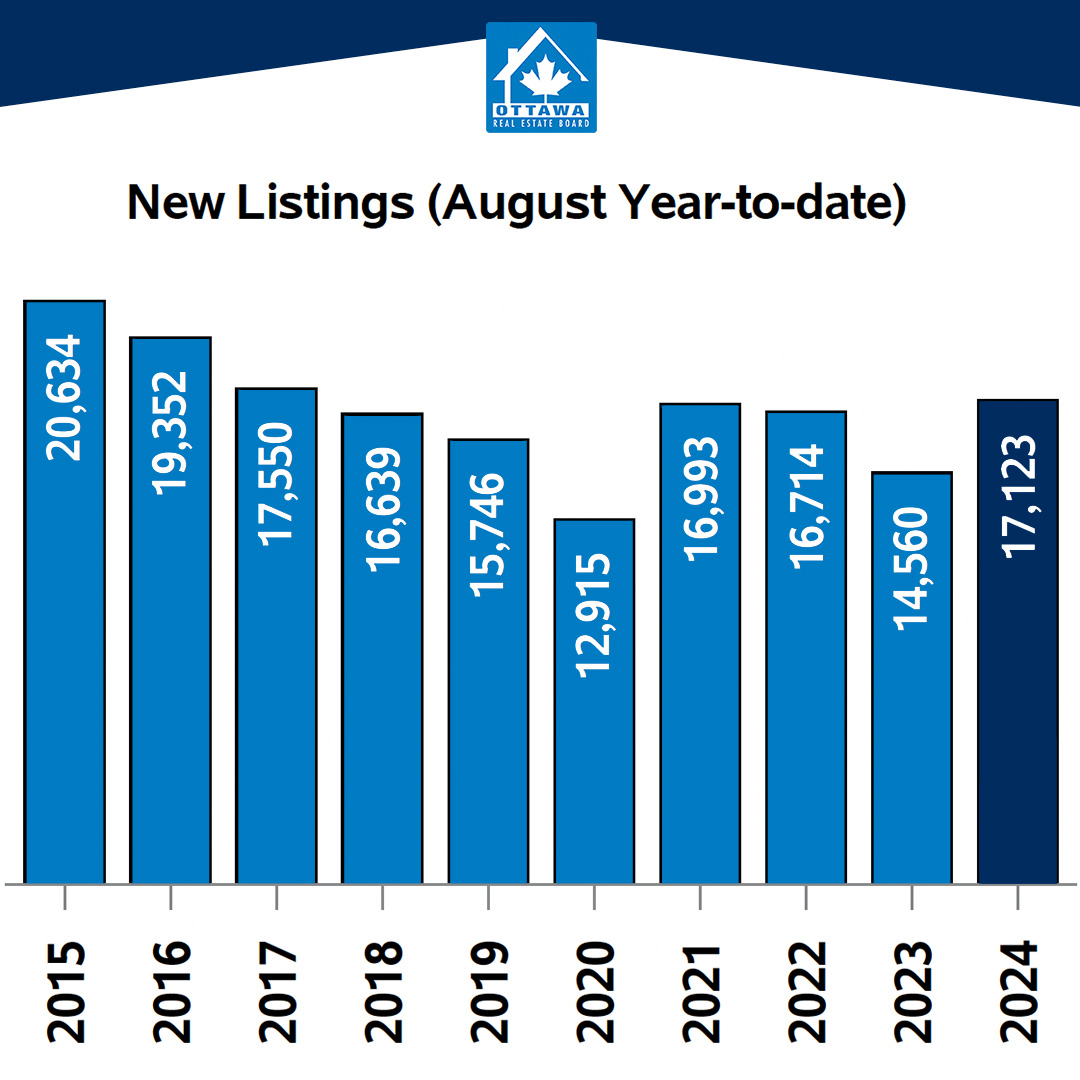
- The number of new listings saw an increase of 0.2% from August 2023. There were 1,907 new residential listings in August 2024. New listings were 0.2% above the five-year average and 0.9% above the 10-year average for the month of August.
- Active residential listings numbered 3,324 units on the market at the end of August 2024, a gain of 25.8% from August 2023. Active listings were 46.5% above the five-year average and 1.3% below the 10-year average for the month of August.
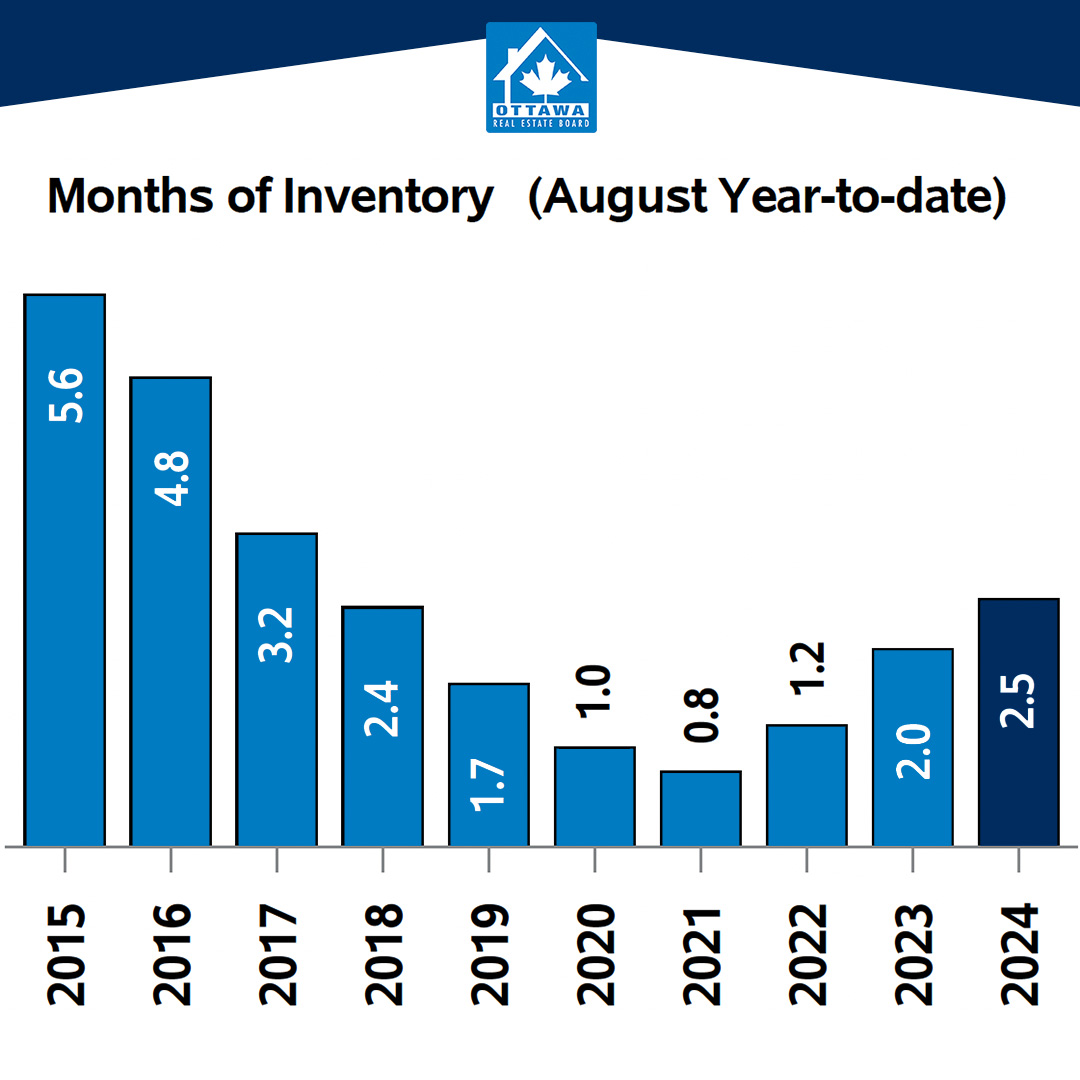
- Months of inventory numbered 3.0 at the end of August 2024, up from 2.6 in August 2023. The number of months of inventory is the number of months it would take to sell current inventories at the current rate of sales activity.
-